
Figure 2.
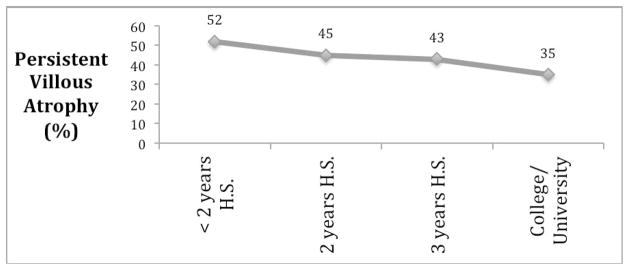
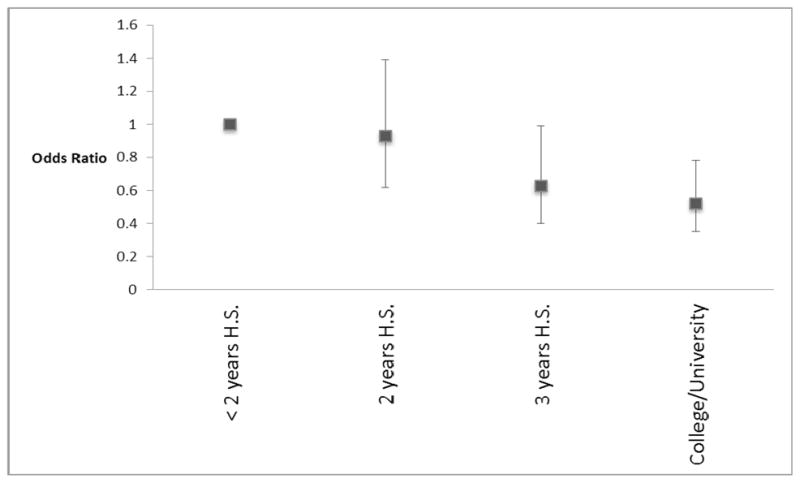
Figure 2A: Prevalence of persistent villous atrophy, stratified by educational attainment. H.S.=High School
Figure 2B: Association between educational attainment and persistent villous atrophy (adjusted for age, gender, duration of disease, and calendar period). Odds ratios <1 refer to lower odds of persistent villous atrophy. Corresponding 95% confidence intervals are shown by error bars.