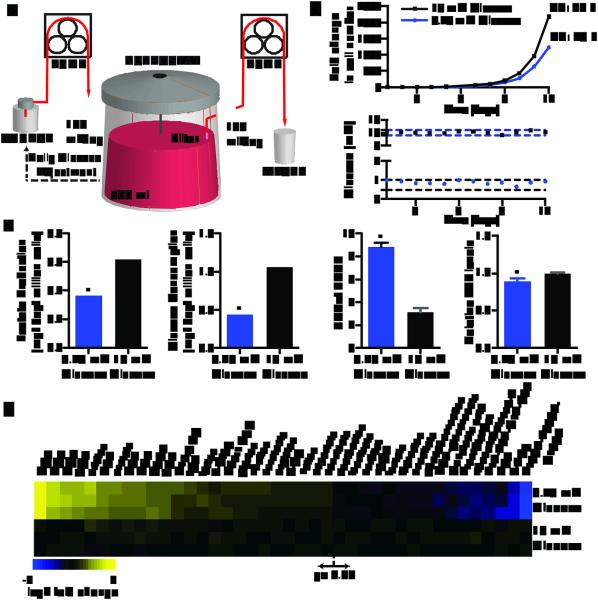
Figure 1. Nutrostat design and metabolic characterization of cancer cells under chronic glucose limitation.
a, Nutrostat Schematic. b, Fold change in cell number (top) and media glucose concentration (bottom) of Jurkat cells grown in Nutrostats at 10 mM (black) or 0.75 mM (blue) glucose. DT = doubling time. c, Indicated metabolite levels in Nutrostats at 10 mM (black) or 0.75 mM (blue) glucose. d, Differential intracellular metabolite abundances (p < 0.05) from cells in Nutrostats at 10 mM (bottom three rows) or 0.75 mM (top three rows) glucose. Color bar indicates scale (Log2 transformed). Error bars where shown are SEM (n=2 (glucose and lactate), 3 (NAD(H) ratio) and 8 for ATP levels). Replicates are biological, means reported. Asterisks indicate significance p < 0.05 by two-sided student’s t-test.

