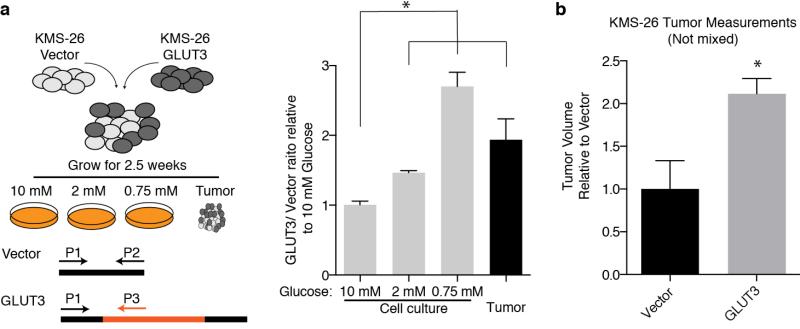
Extended Data Fig. 6. GLUT3 over-expression increases tumor xenograft growth and cell proliferation in low glucose media.
a, KMS-26 cell lines infected with GLUT3 overexpressing vector or infected with control vector were mixed in equal proportions and cultured under different glucose concentrations. Additionally, these mixed cell lines were injected into NOD/SCID mice subcutaneously. 2.5 weeks later, genomic DNA was isolated from tumors as well as cells grown in vitro under the indicated glucose concentrations. Using qPCR, relative abundance of control vector and GLUT3 vector were determined and plotted relative to 10 mM glucose in culture (n=9). b, Average volume of unmixed tumor xenografts from KMS-26 cell lines infected with GLUT3 overexpressing vector relative to control vector (2.5 weeks) (n=6). Replicates are biological, means reported. Asterisks indicate significance p < 0.05 by two-sided student’s t-test.

