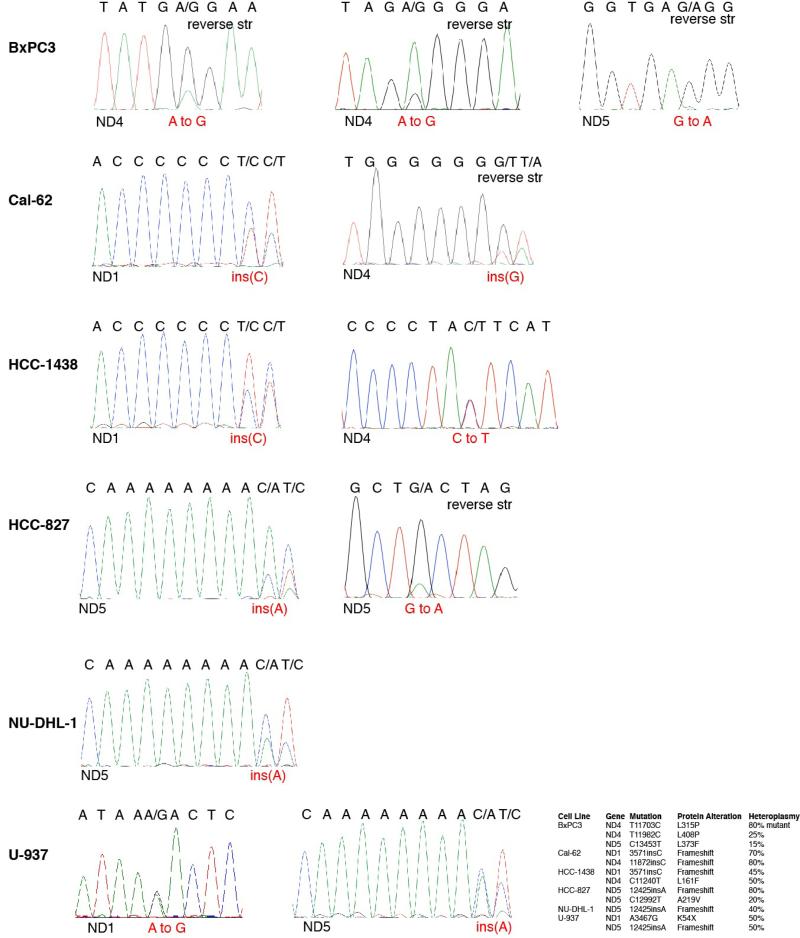
Extended Data Fig. 7. Sanger sequencing traces validating mtDNA mutations.
The table summarizing mtDNA mutations in Complex I subunits from Fig. 3j is reproduced at the lower right. Traces for each cell line (left) are shown in the order indicated by the table. “Reverse str” indicates instances when the sequence shown is in the reverse orientation to the revised Cambridge Reference Sequence. For each trace, the gene sequenced is at the bottom left, the DNA sequence is at the top, and the nucleotide alteration is in red text.

