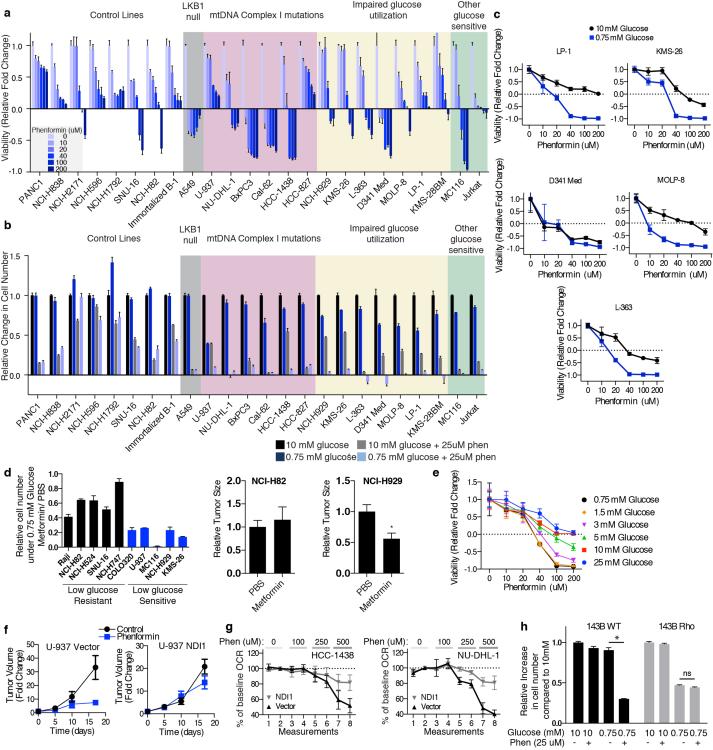
Extended Data Fig. 8. Additional data supporting the hypersensitivity of cell lines with the identified biomarkers to biguanides.
a-b, Viability (a, 10 mM glucose) or relative change in cell number (b, 4 days, glucose concentration indicated in key) of indicated cell lines at phenformin concentrations indicated. Viability measured by ATP levels on Day 3 at phenformin concentrations indicated by black-blue scale, compared to ATP levels on Day 0. Value of 1 indicates fully viable cells (untreated). Value of 0 indicates no change in ATP level compared to Day 0 (cytostatic). Negative values indicate decrease in ATP levels (-1 indicates no ATP). c, Viability as in (a) of indicated cell lines under 0.75 mM and 10 mM glucose at indicated phenformin concentrations. d, Left, relative change in cell number in 0.75 mM glucose, 2 mM metformin relative to untreated in glucose limitation resistant (black) and sensitive (blue) cell lines. Right, relative size of tumor xenografts derived from the indicated cell lines in mice injected with PBS or metformin (IP, 300 mg/kg/day). e, Viability as in (a) of NCI-H929 cells at the indicated concentrations of phenformin and glucose. f, Relative size of indicated cell line xenografts in mice treated with PBS or phenformin (1.7 mg/ml in drinking water). g, Percent change in oxygen consumption rate (OCR) of control (Vector) or NDI1-expressing lines (NDI1) relative to the second basal measurement and at indicated phenformin concentrations. h, Proliferation of 143B wild type or 143B rho (no mtDNA) cell lines under 0.75 mM or 10 mM glucose with or without phenformin treatment. Error bars are SEM (n=4 for a, c, e, g; n=3 for b, d, and h (left); n=5 for d (right) and f). Replicates are biological, means reported. Asterisks indicate significance p < 0.05 by two-sided student’s t-test.

