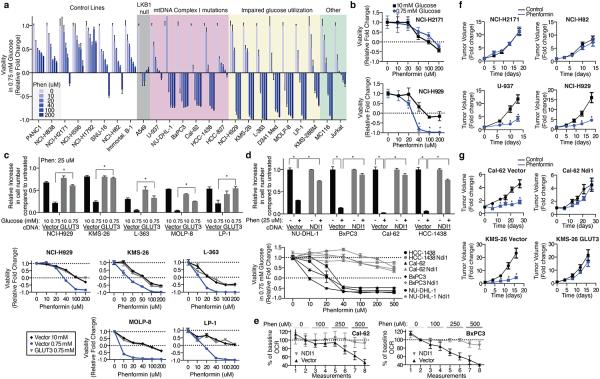
Figure 4. Cancer cells with deficiencies in glucose utilization or Complex I are sensitive to phenformin.
a, Viability of indicated lines, as measured by ATP levels on Day 3 at phenformin concentrations indicated by black-blue scale, in 0.75 mM glucose, compared to ATP levels on Day 0. Value of 1 indicates fully viable cells (untreated). Value of 0 indicates no change in ATP level compared to Day 0 (cytostatic). Negative values indicate decrease in ATP levels (-1 indicates no ATP). b, Viability as in a of NCI-H2171 and NCI-H929 cell lines under 0.75 and 10 mM glucose. c, Relative increase in cell number (top) and viability as in a (bottom) of control (Vector) or GLUT3 over-expressing (GLUT3) cell lines in 10 mM or 0.75 mM glucose at indicated phenformin concentrations relative to untreated cells in 10 mM glucose. d, Relative increase in cell number (top) and viability as in a (bottom) of vector control (black) or NDI1 (grey) expressing lines in 0.75 mM glucose at indicated phenformin concentrations relative to untreated cells in 0.75 mM glucose. e, Percent change in oxygen consumption rate (OCR) of control (Vector) or NDI1-expressing lines (NDI1) relative to the second basal measurement at indicated phenformin concentrations. f, Average volume (relative to Day 0) of established xenografted tumours derived from control (NCI-H2171, NCI-H82), mtDNA Complex I mutant (U-937), or impaired glucose utilization (NCI-H929) cell lines in mice treated with vehicle (black) or phenformin (blue) in drinking water starting at Day 0. g, Average tumor volume as in f of indicated cell lines infected with control, NDI1- or GLUT3-expressing vectors. Error bars are SEM (n=5 for a, b, c (bottom), d (bottom), e and f; n=6 (control) or n=8 (GLUT3 or NDI1) for g; n=3 for c (top) and d (top)). Replicates are biological, means reported. Asterisks indicate significance p < 0.05 by two-sided student’s t-test.

