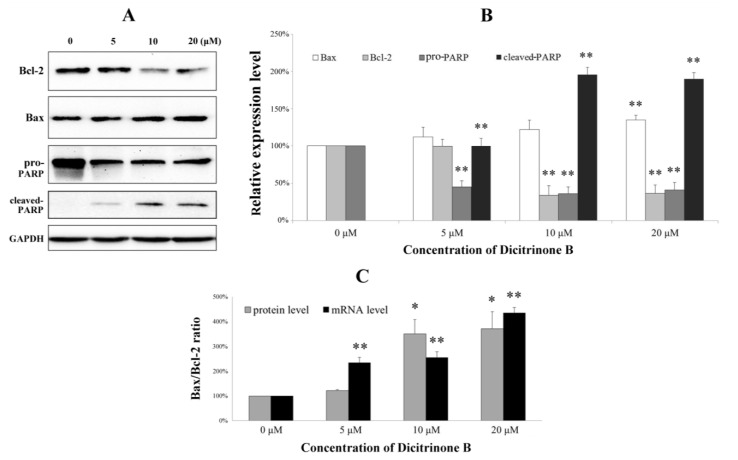
Figure 8.
Real-time quantitative PCR and western blot analysis of the apoptosis-associated proteins in A375 cells. (A) After cells were treated with a different concentration of dicitrinone B for 24 h, the expressions of Bcl-2, Bax, pro-PARP and cleaved-PARP were determined by western blot, with GAPDH as a loading control. (B) Quantitative Bcl-2, Bax, pro-PARP and cleaved-PARP expressions after normalization to GAPDH. (C) The ratio of Bax/Bcl-2 at the protein and mRNA level in A375 cells treated with dicitrinone B (zero, five, 10 and 20 μM) for 24 h. Data are expressed as the mean ± SEM (n = 3). Significant differences between the treatment and control groups are indicated as * (p < 0.05) or ** (p < 0.01).

