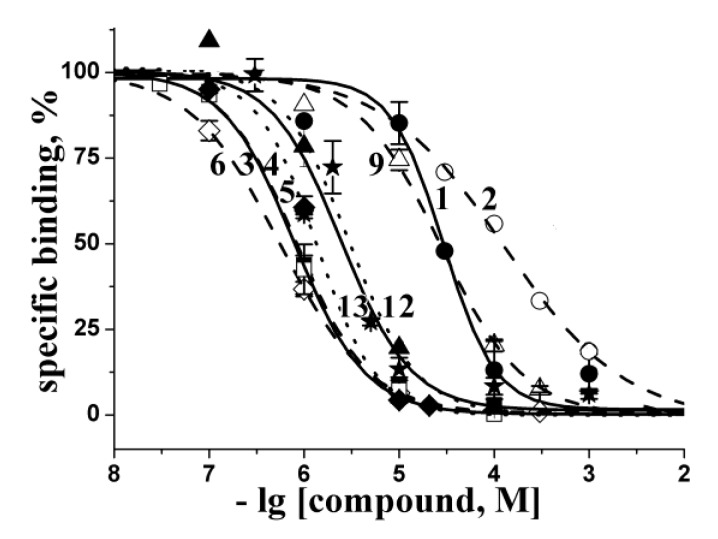
Figure 2.
Inhibition of [125I]-αBgt binding to L. stagnalis AChBP with the most active compounds studied. Numbering the compounds corresponds to the numbering in Figure 1. The corresponding curves are marked with symbols: 1—filled circles; 2—open circles; 3—filled squares; 4—open squares; 5—filled diamonds; 6—open diamonds; 9—open triangles; 12—filled triangles; 13—stars. Each point is a mean ± s.e.m value of two or three measurements for each concentration. The curves were calculated from the means ± s.e.m. using ORIGIN 7.5 program (see Experimental Section). The respective Ki values are listed in Table 1.

