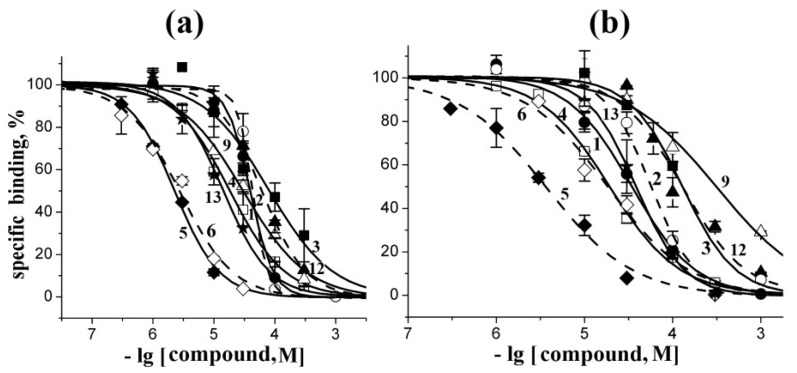
Figure 4.
Inhibition of initial rate for [125I]-αBgt binding to T. californica nAChR (a) or human α7 nAChR (b) with the most active compounds studied. Numbering the compounds and their symbols correspond to the numbering in Figure 1 and symbols in Figure 2, respectively. Each point is a mean ± s.e.m value of two or three measurements for each concentration. The curves were calculated from the means ± s.e.m. using the ORIGIN 7.5 program (see Experimental Section). The respective Ki values are listed in Table 2.

