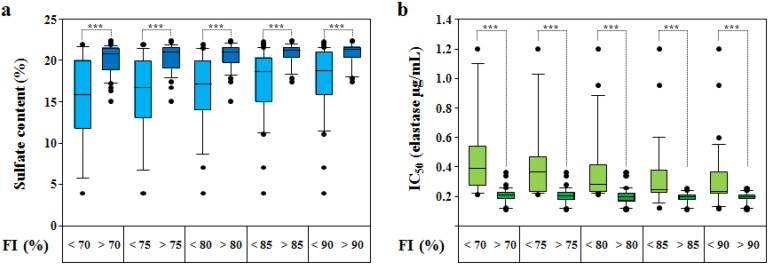
Figure 5.
(a) Sulfate contents of 57 D.s.-SP batches and (b) IC50 (µg/mL, elastase activity assay) of 55 D.s.-SP batches sorted by their fluorescence intensity (FI) increase (%, related to 3.75 µg/mL fondaparinux) at 7.5 µg/mL being either ≤ or > than a certain value (i.e., 70%, 75%, 80%, 85% and 90% of the fondaparinux FI increase at 3.75 µg/mL). Boxplots: median (black line), 25th and 75th percentile (end of the boxes), 10th and 90th percentile (error bars), outliers (black points); p-values calculated by Mann-Whitney Rank Sum Test (SigmaPlot 11.0); *** p ≤ 0.001.

