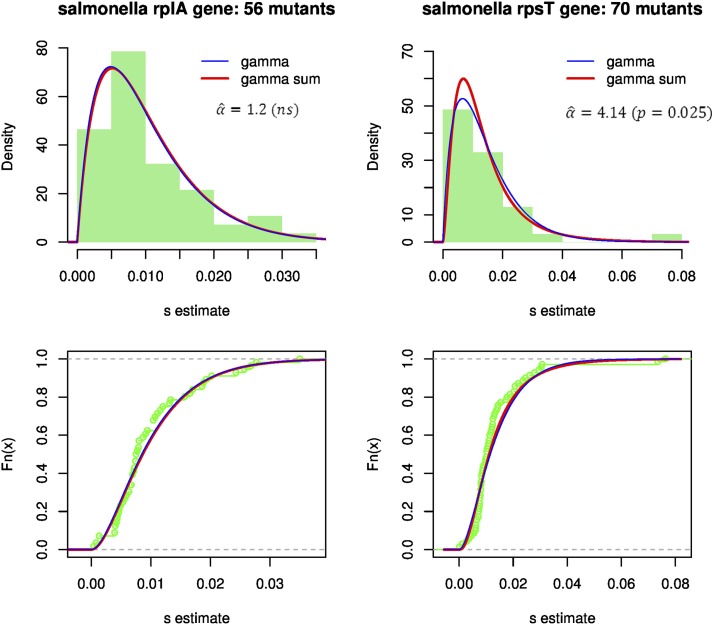
Figure 6.
Fit of the gamma and gamma sum models to empirical DFEs in bacteria. Top, the distribution of selection coefficients among random nucleotide substitutions vs. alternative fitted models: Equation 11 with (a gamma distribution, blue curve) or α freely fitted (a convolution of two gammas, red curve). Bottom, the corresponding empirical cumulative distribution function vs. fitted models. The values of the best-fit parameters are given in Table 2. The significance of the test for vs. is given below the estimated value.

