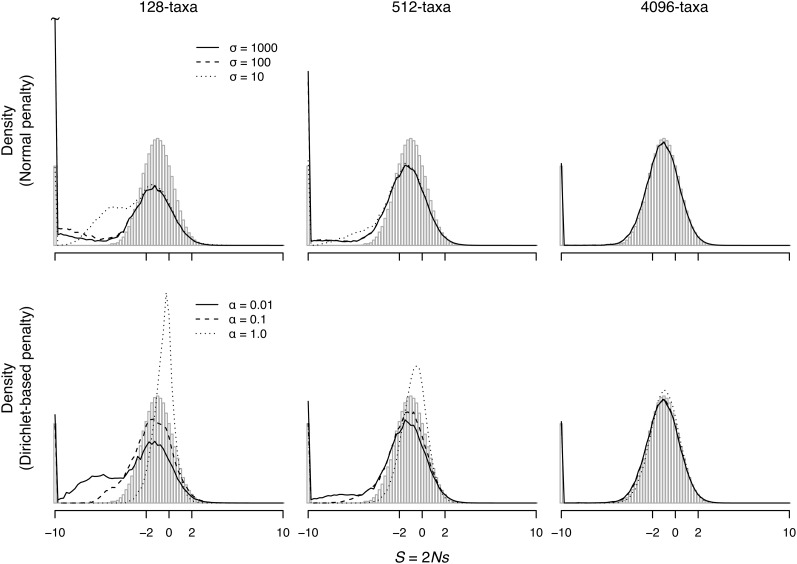
Figure 2.
Estimated and true distribution of S (for nonsynonymous mutations) for simulated data when the fitnesses are sampled from a unimodal distribution. The true distribution is shown as vertical shaded bars. The distributions are calculated using Equation 4 by dividing the range of S from −10 to 10 into equally spaced bins with wI = 0.25. Mutations with S ≤ −10 or those with S ≥ 10 are binned together. We consider mutations to STOP codons to be lethal, and these are included in the calculation of h(−10).

