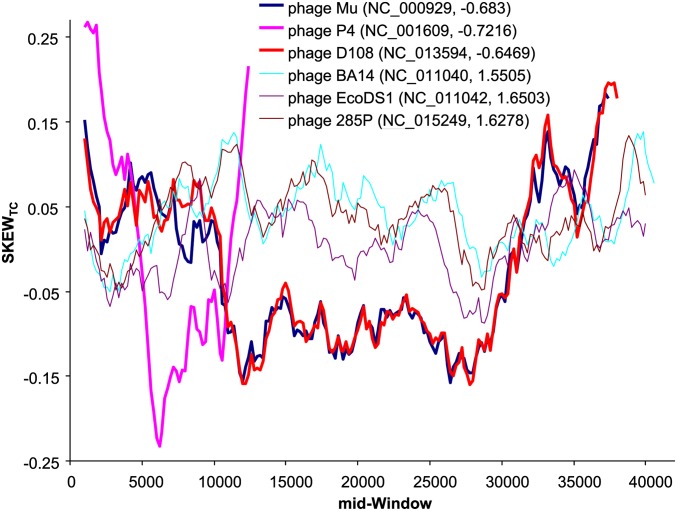
Figure 9.
TC skew, defined as (NT − NC)/(NT + NC), for three phages with the most negative slopes and three phages with the most positive slopes, plotted over sliding windows (window width = 2000 nt and step size = 200). Phage P4 is much shorter than the others and requires coinfection by phage P2 to complete its lytic cycle. The key shows the phage name with the GenBank accession number and the slope from regression of PU on φ.

