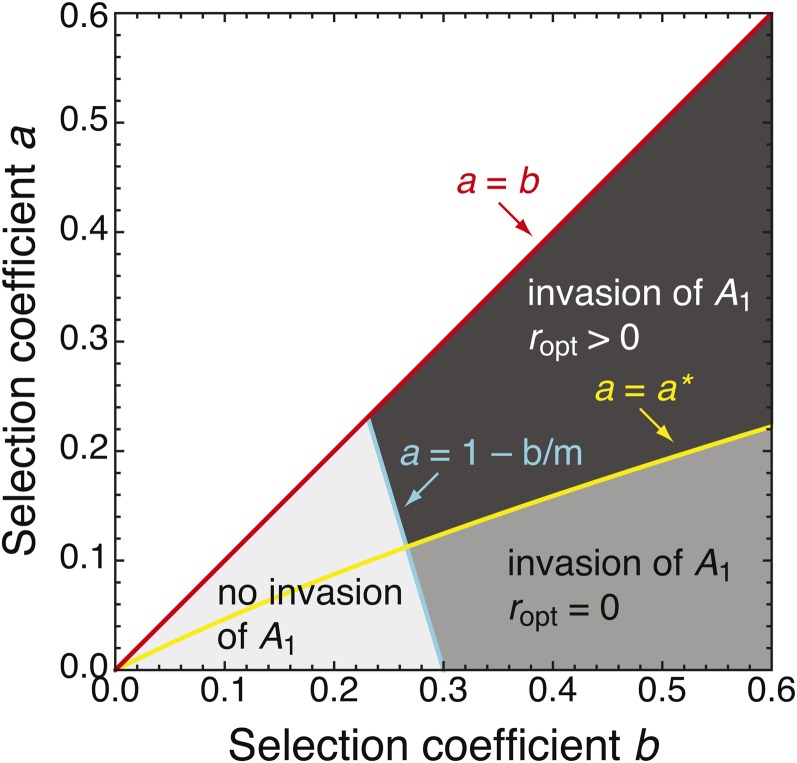
Figure 3.
Optimal recombination rate and regions of invasion. The dark shaded area indicates where the optimal recombination rate r is positive (ropt > 0; cf. Figure 1B). The medium shaded area shows the parameter range for which ropt = 0 (cf. Figure 1A). Together, these two areas indicate where A1 can invade via the marginal one-locus migration–selection equilibrium EB if r is sufficiently small. The light shaded area shows where EB does not exist and A1 cannot invade via EB. The area above a = b is not of interest, as we focus on mutations that are weakly beneficial compared to selection at the background locus (a < b). The critical selection coefficient a∗ is given in Equation 14 and the migration rate is m = 0.3 (other values of m yield qualitatively similar diagrams). The continent is monomorphic (qc = 0).

