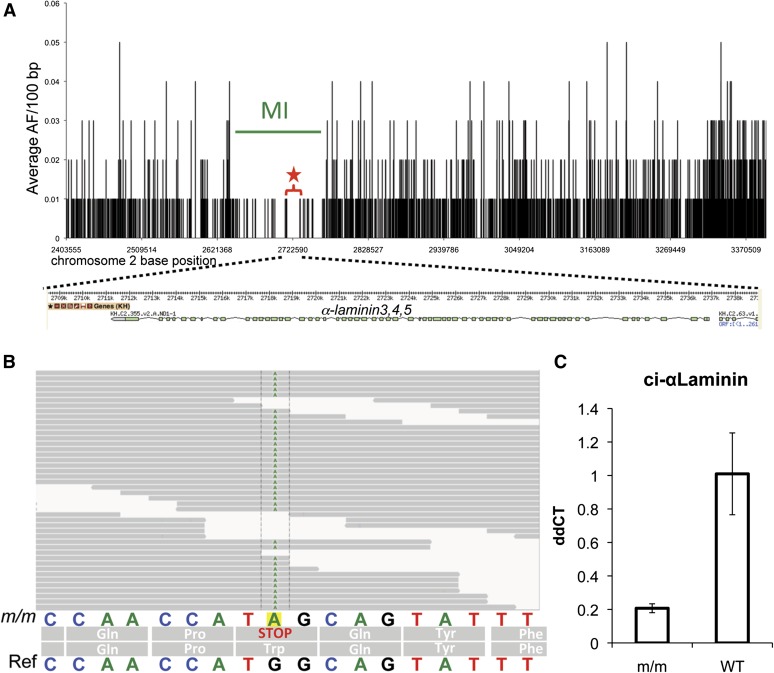
Figure 3.
Fine-mapping of the chm-like mutation. (A) The average allele frequency (AF) for 100-bp windows is plotted against nucleotide position for a 1-Mb region of interest (ROI) from chromosome 2 (2.4–3.4 Mb). The likely causative mutation was found in a 17-kb segment from 2.714 to 2.731 Mb. Interestingly, this region was the longest stretch with a complete absence of heterozygous allele frequencies (red star and bracket). A schematic of the α-laminin3,4,5 gene model is shown below the graph. (B) The nonsense mutation (G to A)in the α-laminin3,4,5 gene was found in all the of the aligned m/m reads. The sequence of the reference genome (ref) is shown at the bottom. (C) qRT–PCR of α-laminin3,4,5 in homozygous mutant (m/m) and WT cDNA samples. Bars indicate average of three samples and error bars calculated on the basis of standard deviation in the three replicates. ddCT values were calculated by normalizing to actin cDNA levels within each sample and then comparing mutant and wild-type levels.

