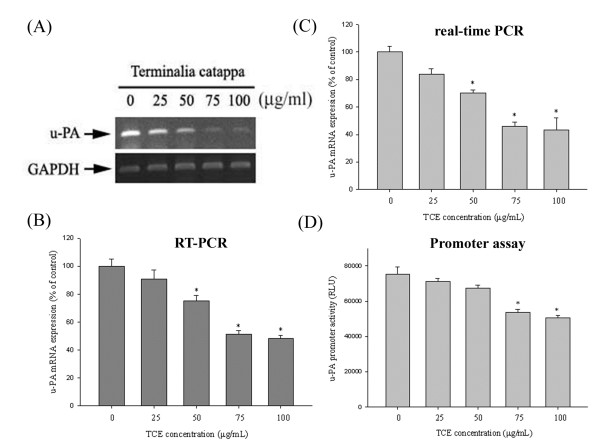
Figure 2.
Effects of TCE suppression on u-PA expression at a transcriptional level. Huh7 cells were treated with TCE (0, 25, 50, 75, and 100 μg/mL) for 24 h and then subjected to RT-PCR (A, B) and quantitative real-time PCR (C) to analyze the mRNA expression of u-PA. (D) u-PA promoter reporter assay to analyze the promoter activity of u-PA. Luciferase activity, determined in triplicate, was normalized to β-galactosidase activity. The values in this figure represent the means ± SD of at least 3 independent experiments. *p < 0.05 as compared with the vehicle group.

