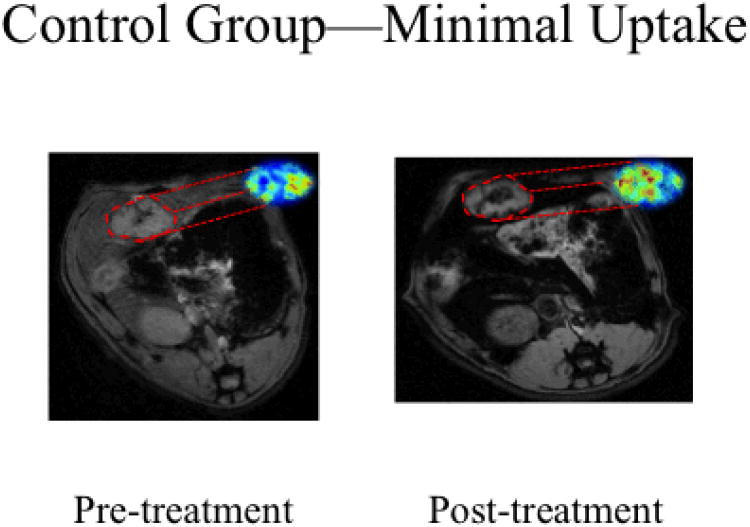
Figure 3.
SPIO IV delivery in control N1S1 rats on 7T MRI. Representative axial T2*W GRE images (TE: 11.9 ms) images with corresponding with R2* parametric maps from the same animal. Signal intensities were measured in the same plane to determine tumor SPIO uptake. Following SPIO delivery in the control group we saw minimal signal change in the tumor tissue, highlighted here in red, confirming limited uptake with conventional intravenous delivery

