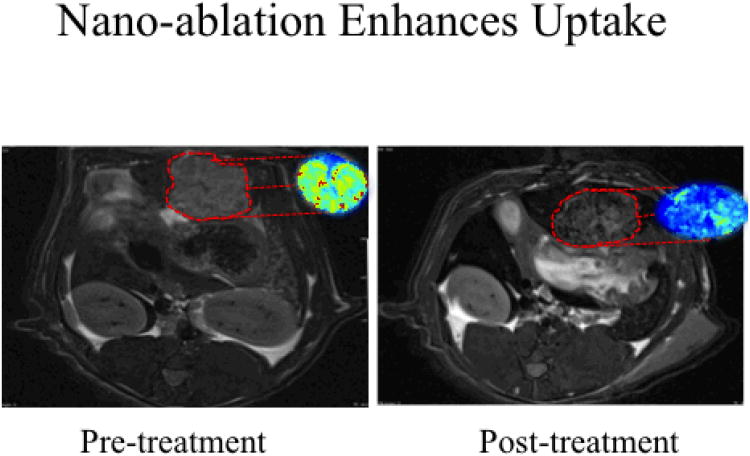
Figure 4.
SPIO delivery in nano-ablation treated N1S1 rats on 7T MRI. Representative axial T2*W GRE images (TE: 11.9 ms) images with corresponding with R2* parametric maps from the same animal. Signal intensities were measured in the same plane to determine tumor SPIO uptake. Following nano-ablation, animals in the treatment group demonstrated significant R2* signal changes within tumor tissues, highlighted in red.

