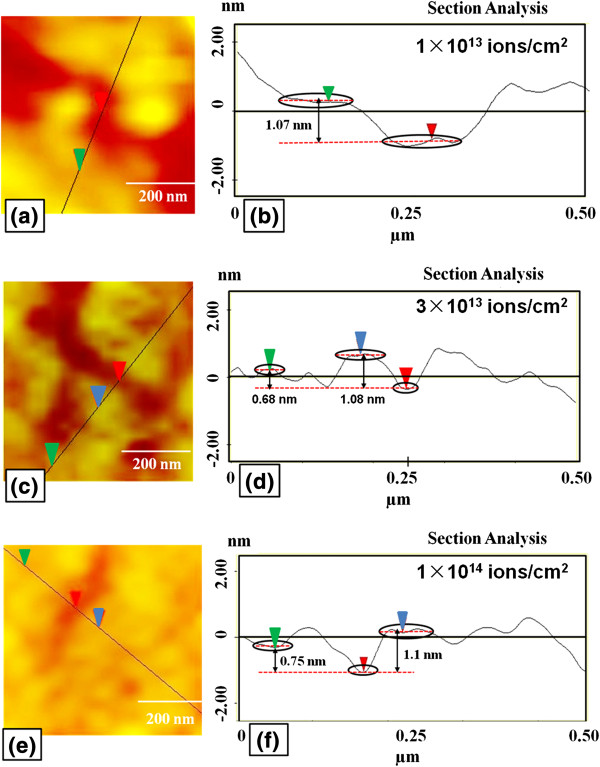
Figure 10.
Atomic force microscopy imaging and corresponding section analyses of irradiated part of samples. Atomic force microscopy imaging of irradiated part of graphene is shown at fluences (a) 1 × 10¹³, (c) 3 × 10¹³ and (e) 1 × 10¹⁴ ions/cm2, and corresponding section analyses is shown in (b), (d) and (f), respectively.

