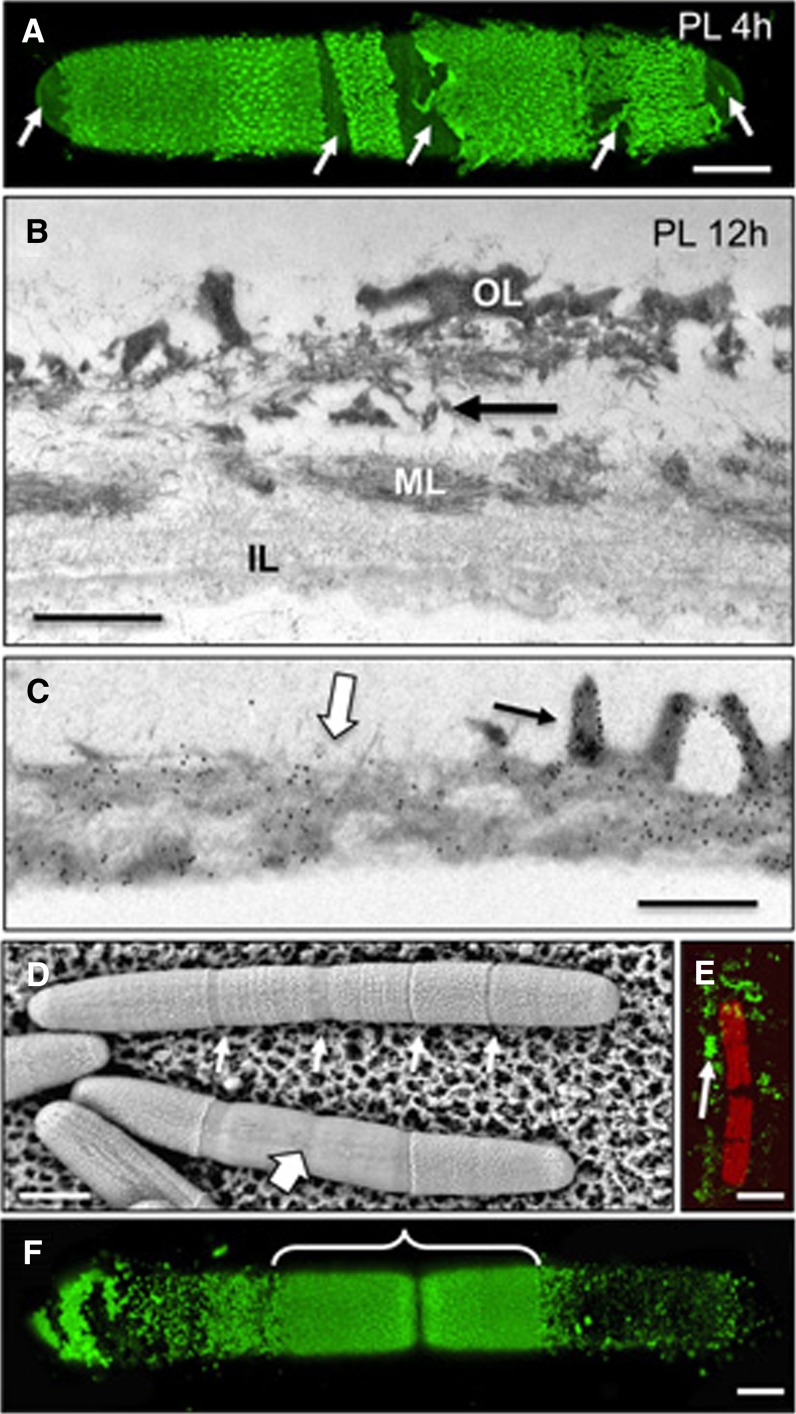
Figure 6.
Effects of PL on lattice formation. A, Confocal image of a cell incubated with PL for 4 h and then labeled with JIM5. Arrows indicate areas of wall digestion. B, TEM image of the cell wall showing the degradation of the OL at its intersection with the ML (arrow). C, JIM5 immunogold labeling of the interface zone of a PL-digested wall and an undigested wall of a cell treated for 12 h. The OL (black arrow) of the undigested zone and the ML of both digested and undigested zones (white arrow) are labeled. D, VPSEM image of PL-treated cells. Initial digestion of the lattice occurs at lattice-free zones of the cell such as the isthmus and lateral bands (small arrows). Further digestion removes large segments of the outer lattice (large arrow). E, JIM5-labeled cell after 36 h of PL digestion. Only remnants of the lattice remain (arrow). F, JIM5 labeling after the cell is allowed to recover for 8 h after 24 h of PL treatment. The area of new lattice formation at the isthmus is bracketed. Bars = 5 µm (A and F), 500 nm (B), 550 nm (C), 16 µm (D), and 25 µm (E).

