Figure 4.
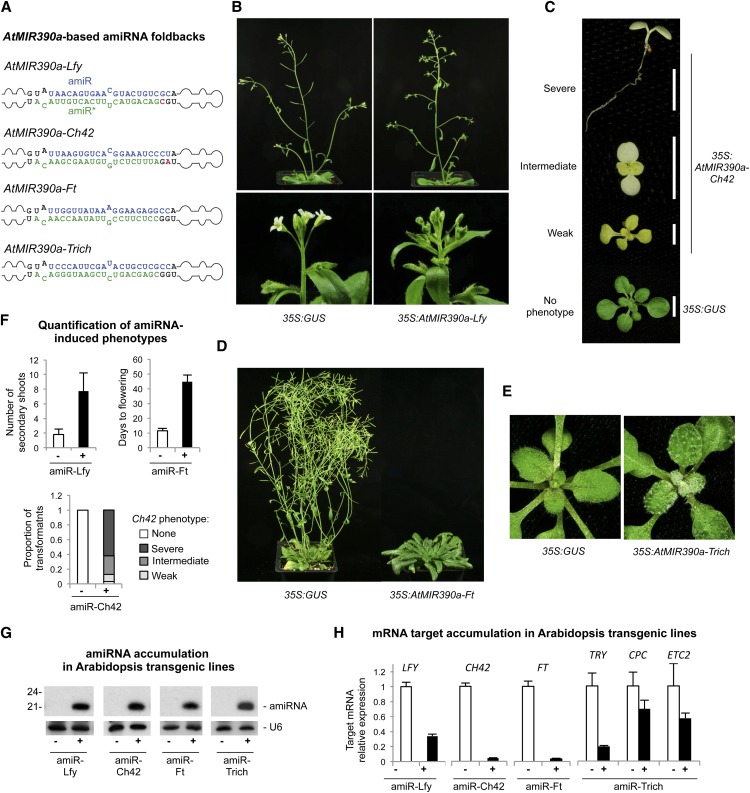
Functionality of AtMIR390a-based amiRNAs in Arabidopsis Col-0 T1 transgenic plants. A, AtMIR390a-based foldbacks containing Lfy-, Ch42-, Ft-, and Trich-amiRNAs. Nt corresponding to the miRNA guide and miRNA* strands are in blue and green, respectively; nt from the AtMIR390a foldback are in black, except those that were modified to preserve authentic AtMIR390a foldback secondary structure, which are in red. B to E show representative images of Arabidopsis Col-0 T1 transgenic plants expressing amiRNAs from the AtMIR390a foldback. B, Adult plants expressing 35S:GUS control (left) and 35S:AtMIR390a-Lfy with increased number of secondary shoots (top right) and leaf-like organs instead of flowers (bottom right). C, Ten-day-old seedlings expressing 35S:AtMIR390a-Ch42 and showing bleaching phenotypes. D, Adult control plant (35S:GUS) and 35S:AtMIR390a-Ft plant with a delayed flowering phenotype. E, Fifteen-day-old control seedling (35S:GUS) and a seedling expressing 35S:AtMIR390a-Trich with increased number of trichomes. F, Quantification of amiRNA-induced phenotypes in plants expressing amiR-Lfy (top left), amiR-Ft (top right), and amiR-Ch42 (bottom). G, Accumulation of amiRNAs in Arabidopsis transgenic plants. One blot from three biological replicates is shown. Each biological replicate is a pool of at least eight independent plants. The U6 RNA blot is shown as a loading control. H, Mean relative level + se of Arabidopsis LFY, CH42, FT, TRY, CPC, and ETC2 mRNAs after normalization to ACTIN2 (ACT2), CAP-BINDING PROTEIN20 (CBP20), SAND, and POLYUBIQUITIN10 (UBQ10), as determined by quantitative RT-PCR (RT-qPCR) (35S:GUS = 1.0 in all comparisons).

