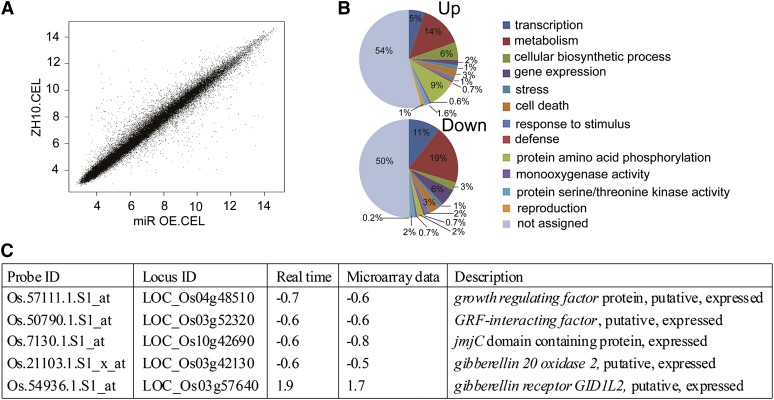
Figure 7.
Global analysis of gene expression in young inflorescences of miROE8 compared with ZH10. A, Scatter graph of signals. Only spots with a present signal were used to determine the false-positive rate. B, Predicated functions of the proteins encoded by up-regulated and down-regulated genes in young inflorescences of miROE8 compared with ZH10 on microarray analysis. C, qRT-PCR analysis of relative transcript levels of selected genes from the rice whole-genome DNA microarray experiment (n = 3; means ± sds).

