Figure 7.
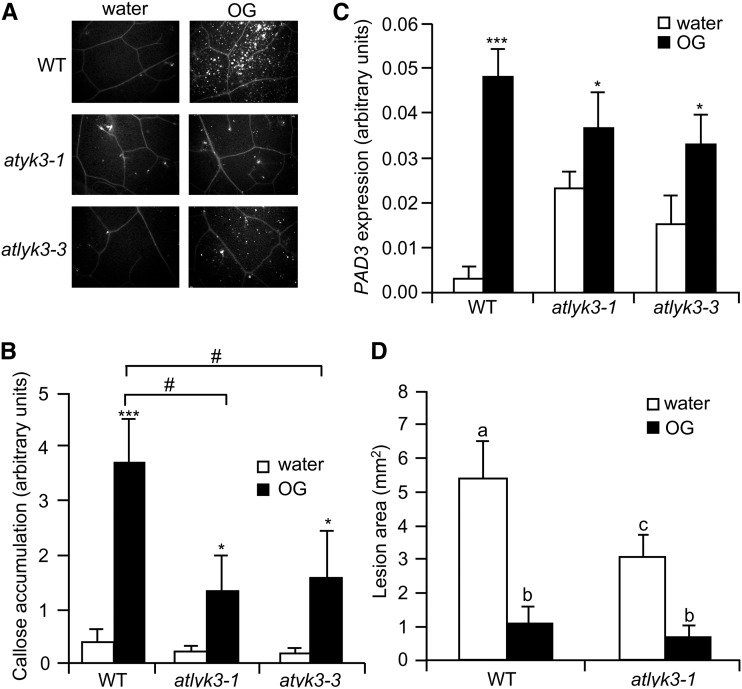
Responses to OGs in atlyk3 mutants. A and B, Rosette leaves of adult wild-type (WT), atlyk3-1, and atlyk3-3 plants were infiltrated with water or 100 μg mL–1 OG. Leaves were harvested after 24 h, and callose deposits were stained with aniline blue. A, Representative pictures of treated leaves obtained with a fluorescence microscope. B, Quantification of callose accumulation. Bars represent average fluorescence ± sd of at least six different samples. Asterisks indicate significant differences between water- and OG-treated samples, according to Student’s t test (*P < 0.05, ***P < 0.01). #, Significant difference between wild-type and mutant leaves treated with OGs, according to Student’s t test (P < 0.05). This experiment was repeated twice with similar results. C, Expression of PAD3 was analyzed by qPCR in wild-type, atlyk3-1, and atlyk3-3 liquid-grown seedlings treated for 3 h with water or 100 μg mL–1 OGs. The UBQ5 gene was used as reference. Bars indicate average expression ± sd of three independent biological replicates. Asterisks indicate significant differences between water- and OG-treated samples, according to Student’s t test (*P < 0.05, ***P < 0.01). D, Four-week-old wild-type and atlyk3-1 plants were sprayed with water or 200 μg mL–1 OGs, and after 24 h, they were inoculated with B. cinerea. Lesion size was measured at 48 h post infection. Bars indicate average lesion area ± se of at least 12 lesions. Different letters indicate statistically significant differences, according to one-way ANOVA followed by Tukey’s honestly significant difference test (P ≤ 0.01). This experiment was repeated three times with similar results.

