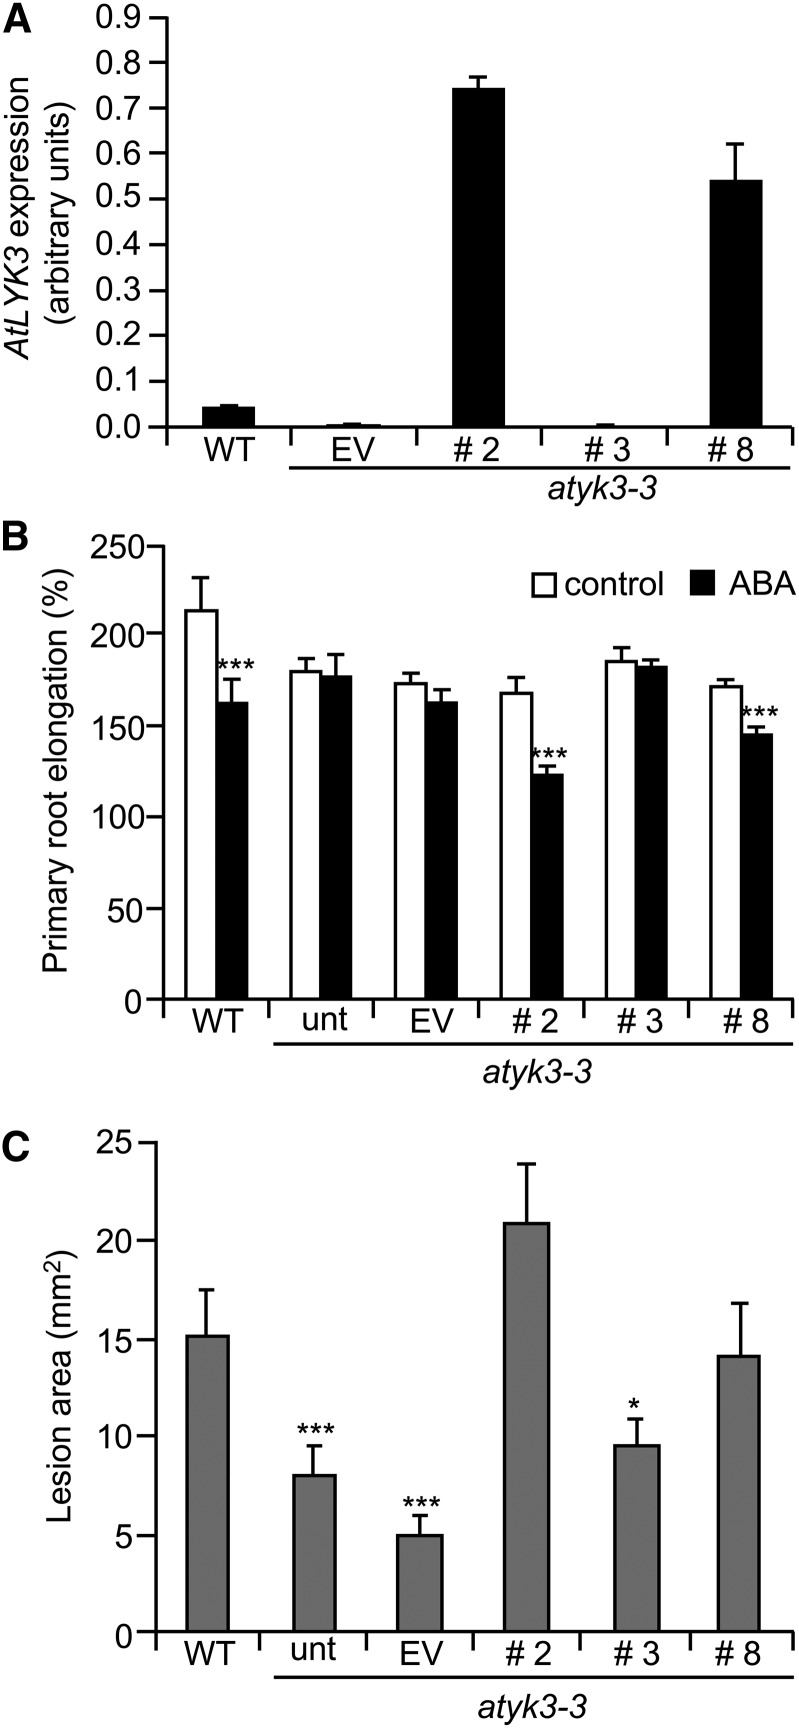
Figure 9.
AtLYK3-GFP complements atlyk3-3 phenotypes. A, atlyk3-3 plants were transformed with a construct for the expression of AtLYK3-GFP under the control of the 35S promoter or with the EV. Expression of AtLYK3 in 10-d-old seedlings of the wild type (WT), three independent AtLYK3-GFP lines (numbers 2, 3, and 8), and one EV line was determined by qPCR, using UBQ5 as control. Bars indicate average expression ± sd of three technical replicates. B, Wild-type and atlyk3-3 untransformed (unt) or transgenic lines were germinated on solid medium and, after 6 d, were transferred to plates supplemented with 0.05% MeOH (white bars) or 5 μm ABA (black bars). For each seedling, primary root length was measured before transfer and at 3 d. Bars indicate the average relative root elongation ± se (n > 10). Asterisks indicate significant differences between control- and ABA-grown seedlings, according to Student’s t test (***P < 0.01). C, Leaves from wild-type and untransformed and transgenic atlyk3-3 4-week-old plants were inoculated with B. cinerea. Lesion area was determined 72 h after infection. Values are means ± se (n ≥ 12). Asterisks indicate statistically significant differences between wild-type and mutant plants, according to Student’s t test (*P ≤ 0.05, ***P ≤ 0.01). This experiment was repeated twice with similar results.

