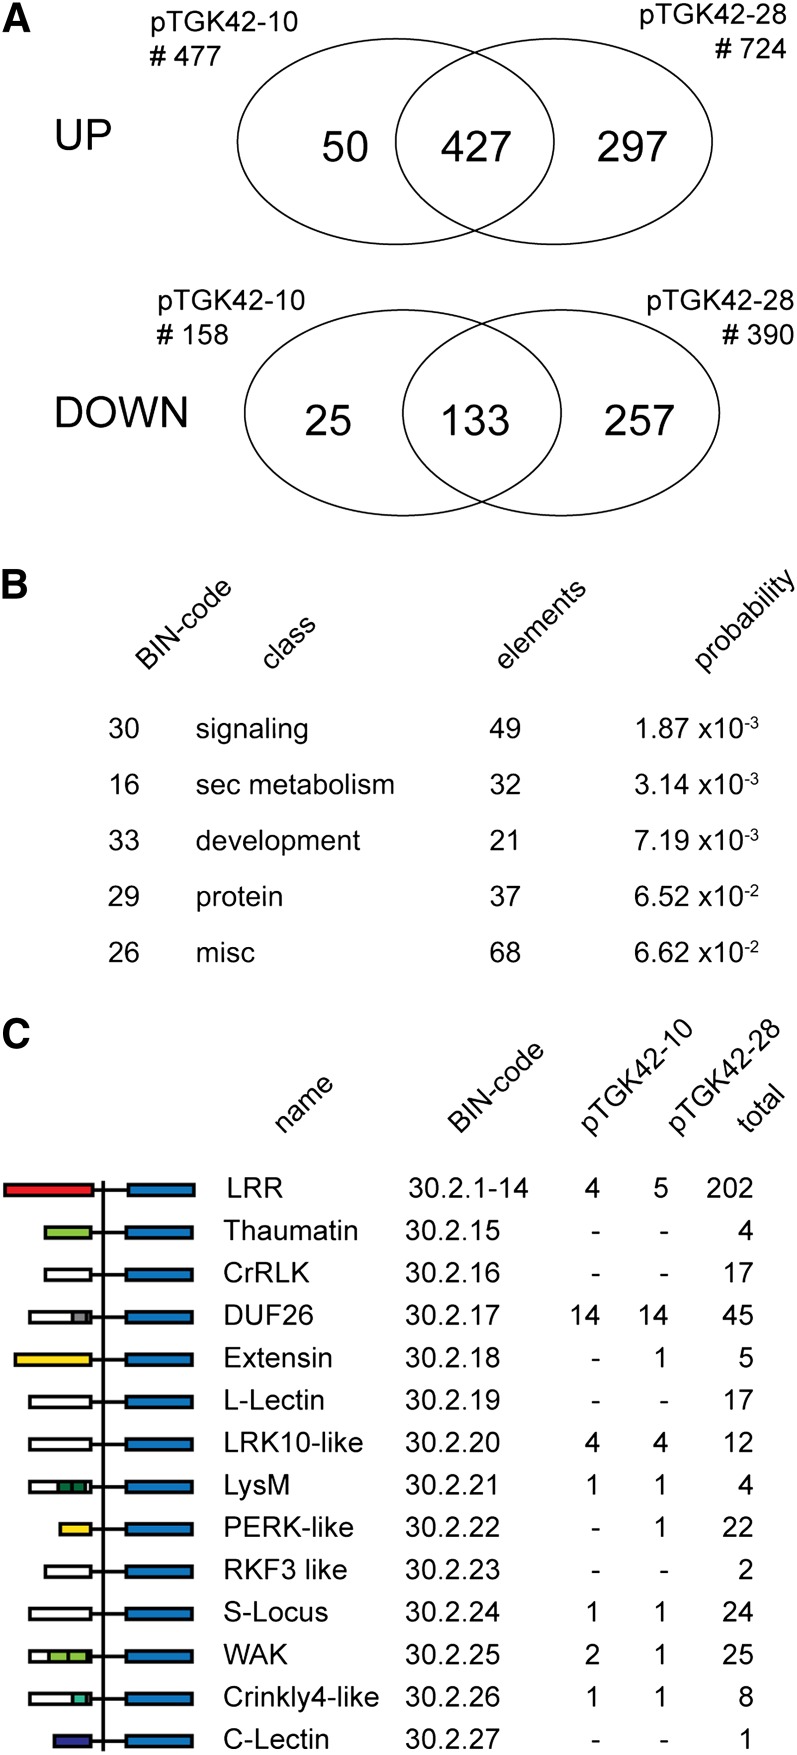
Figure 10.
Gene expression in stem tissue of Arabidopsis upon NodC expression. A, Venn diagrams showing the number of significantly differentially expressed genes upon NodC expression with an expression ratio of at least 2 (P < 0.05). The Venn diagrams indicate the degree of overlap between the different NodC OE lines. Data are derived from microarray analysis using two different NodC OE lines (pTGK42-10 and pTGK42-28). B, Top five overrepresented BIN classes. Only genes at least 2-fold up- or down-regulated in both NodC OE lines (pTGK42-10 and pTGK42-28) compared with the wild type were included. C, Differentially expressed RLKs upon NodC OE in Arabidopsis. For each of the RLK families, the MapMan BIN code is given as well as the total number of genes in this family and the number of significantly differentially expressed family members in pTGK42-10 and pTGK42-28. DUF26 RLKs are overrepresented in the data set where stem tissue of pTGK42-28 or pTGK42-10 is compared with the wild-type. At left, the domain structure of the different RLKs as defined by MapMan is given.

