Figure 5.
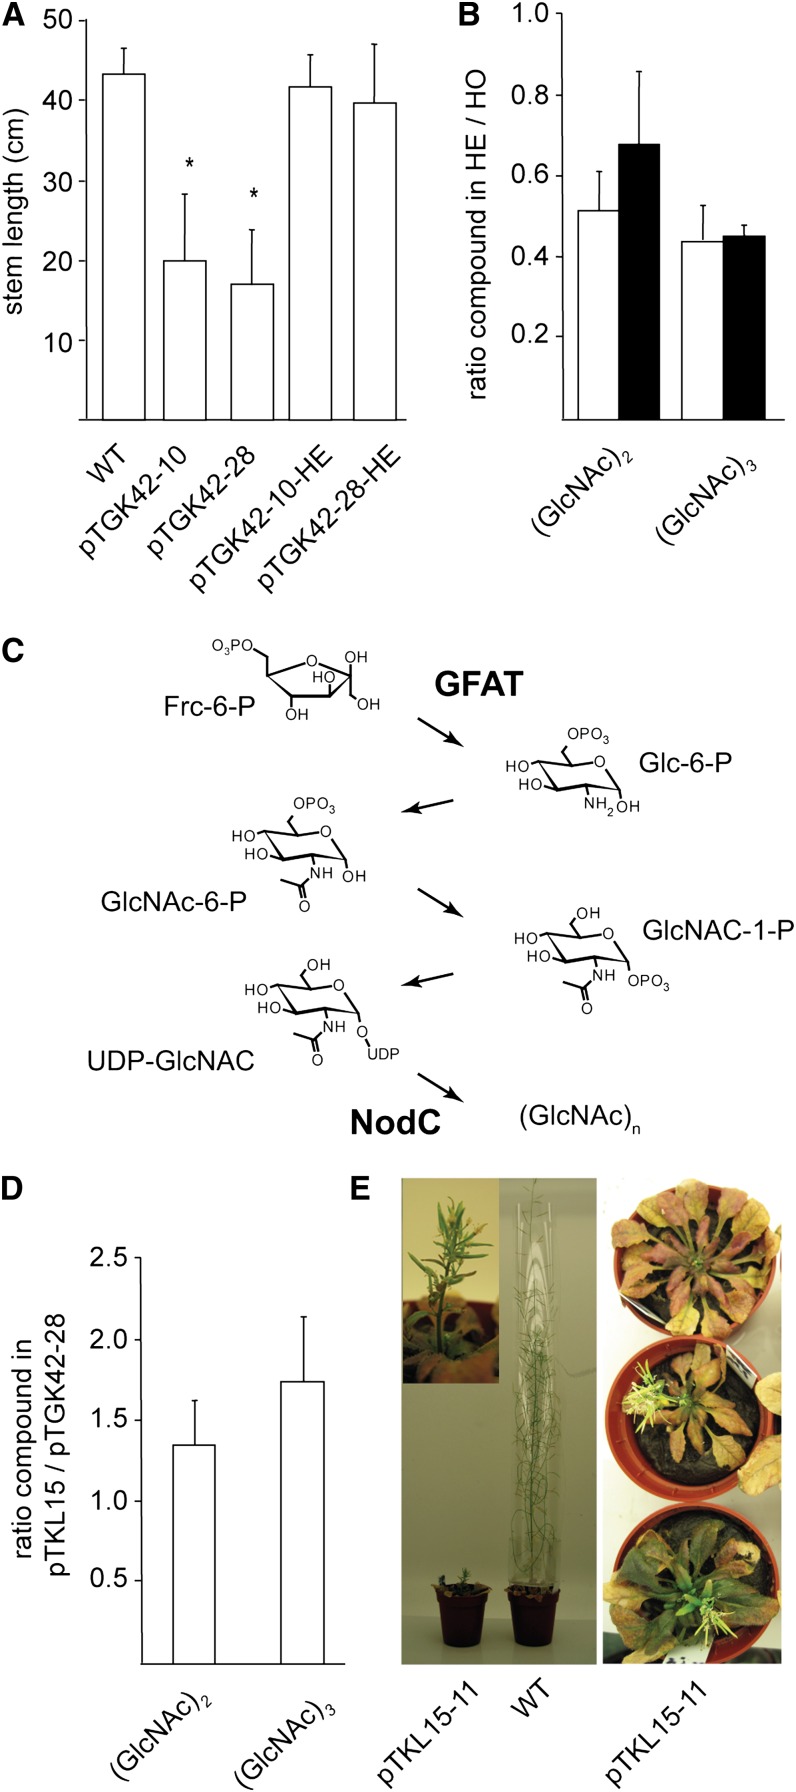
Dose-response effect of GlcNAc oligomer concentration on the phenotype. A, Stem length of hemizygous (pTGK42-10-HE and pTGK42-28-HE) and homozygous (pTGK42-10 and pTGK42-28) NodC OE lines grown under similar conditions. B, Ratio of GlcNAc dimer and trimer concentrations in the hemizygote versus its corresponding homozygote. White bars, pTGK42-10; black bars, pTGK42-28. C, Metabolic pathway toward GlcNAc oligomers. The two enzymes expressed in the pTKL15-11 line are indicated: GFAT catalyzes the rate-limiting step toward UDP-GlcNAc and NodC catalyzes the polymerization of UDP-GlcNAc into GlcNAc oligomers. D, Ratio of GlcNAc dimer and trimer concentrations in pTKL15-11 versus pTGK42-28. E, Phenotype of Arabidopsis line pTKL15-11 in comparison with a wild-type plant of similar age grown under similar growth conditions (6 weeks under SD conditions and 3 weeks under LD conditions). The inset shows a detail of a representative broomhead phenotype. Asterisks indicate statistical significance from wild-type plants of the same batch at P < 0.01 as determined by Student’s t test. Values are means ± sd.

