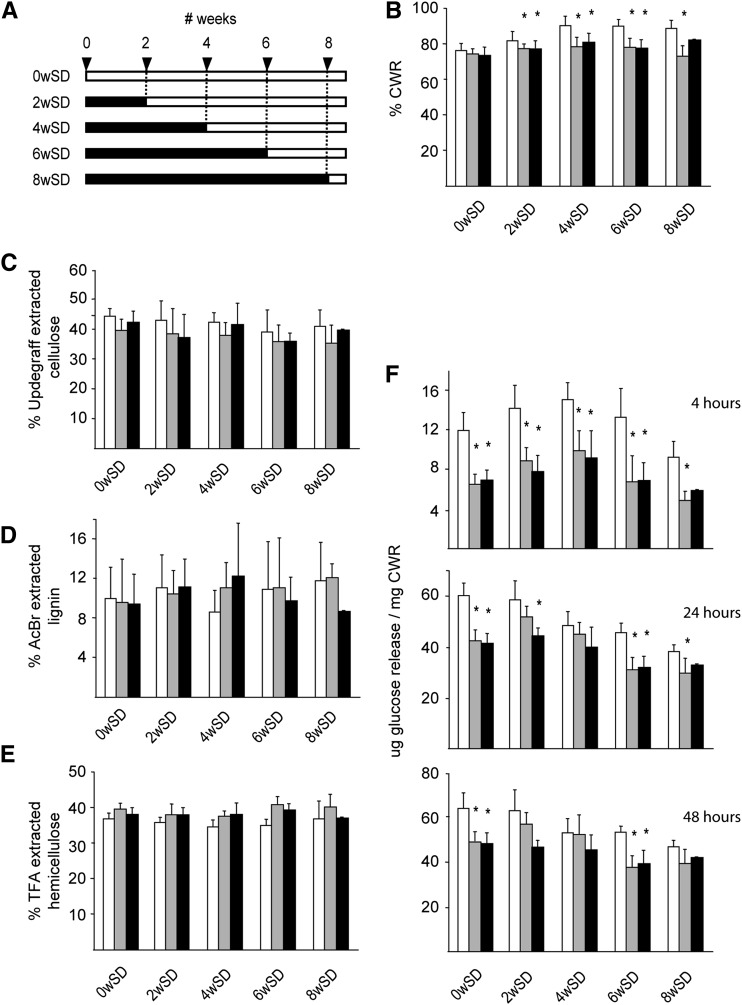
Figure 9.
Chemical composition of the cell walls of the bottom 12-cm stem section of NodC OE lines. A, Scheme of the experimental setup to assess the conditional phenotype (for details, see Fig. 4A). B, Percentage of CWR in dry stem tissue of NodC OE and wild-type plants. C, Cellulose content in percentage of CWR as determined by Updegraff extraction. D, Lignin content in percentage of CWR as determined by acetyl bromide extraction. E, Percentage of TFA-extractable carbohydrates from CWR. F, Total Glc released during saccharification of purified CWR. The y axis denotes the Glc release. Three different hydrolysis times were used: 4 h (top), 24 h (middle), and 48 h (bottom). Day/night conditions for the different batches are explained in Figure 4A. Asterisks indicate statistical significance from wild-type plants of the same batch at P < 0.01 as determined by Student’s t test. Values are means ± sd from at least eight plants per genotype for each batch, with the exception of the 8wSD set, where only four (pTGK42-10) or one (pTGK42-28) stems were available. White bars, Wild type; gray bars, pTGK42-10; black bars, pTGK42-28.

