Figure 1.
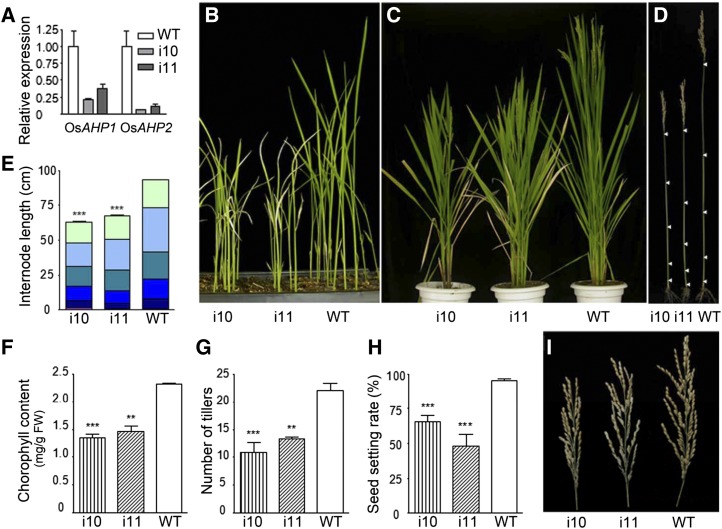
Phenotypes of OsAHP-RNAi transgenic plants. Two RNAi lines, i10 and i11, were used as representatives to compare with the wild type (WT). A, RNA levels of OsAHP1 and OsAHP2 in OsAHP-RNAi transgenic lines as determined by qRT-PCR. Os18S was used as an internal reference. B and C, OsAHP-RNAi transgenic plants showed semidwarf and early leaf senescence phenotypes at the seedling stage (B) and the heading stage (C). D, Primary culms at the mature stage. Arrowheads indicate the nodes. E, Measurement of internode lengths for the plants shown in D (n ≥ 9). F, Chlorophyll contents of the rice leaves at tillering stage (n = 3). FW, Fresh weight. G and H, Statistics for the number of tillers (G) and seed setting rate (H) in the OsAHP-RNAi and wild-type lines at the mature stage (n ≥ 4). I, Panicles of OsAHP-RNAi and wild-type lines. Error bars represent sd. Asterisks indicate that the value is significantly different from the value for the wild type as determined by Student’s t test (***P < 0.001, ** P < 0.01).

