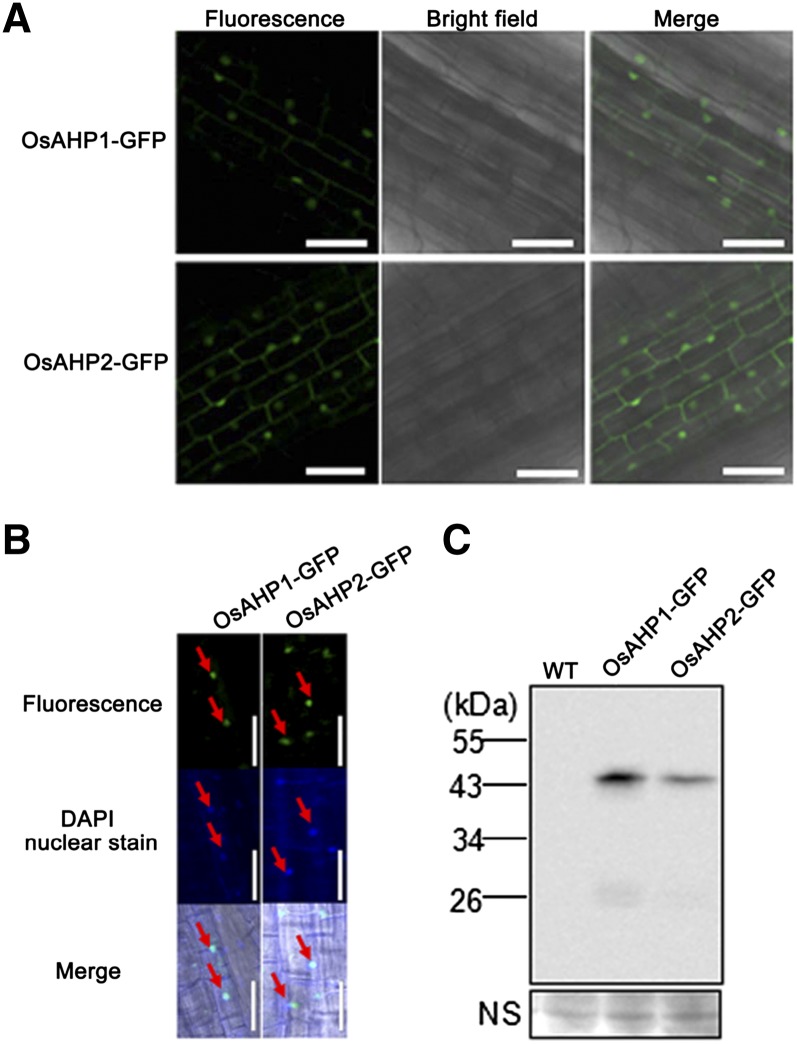
Figure 4.
Nuclear and cytosolic localization of OsAHP1 and OsAHP2. A, Confocal images of root cells from transgenic rice harboring 2×35S::OsAHP1-GFP or 2×35S:OsAHP2-GFP. Bars = 50 μm. B, DAPI staining of A. Arrows indicate the overlay of the fluorescent signal with the nuclear DAPI signal. Bars = 50 μm. C, Western-blot assay of GFP fusion proteins in 2×35S::OsAHP1-GFP or 2×35S::OsAHP2-GFP transgenic rice roots using anti-GFP antibodies. NS, Nonspecific band used as a loading reference; WT, wild type.

