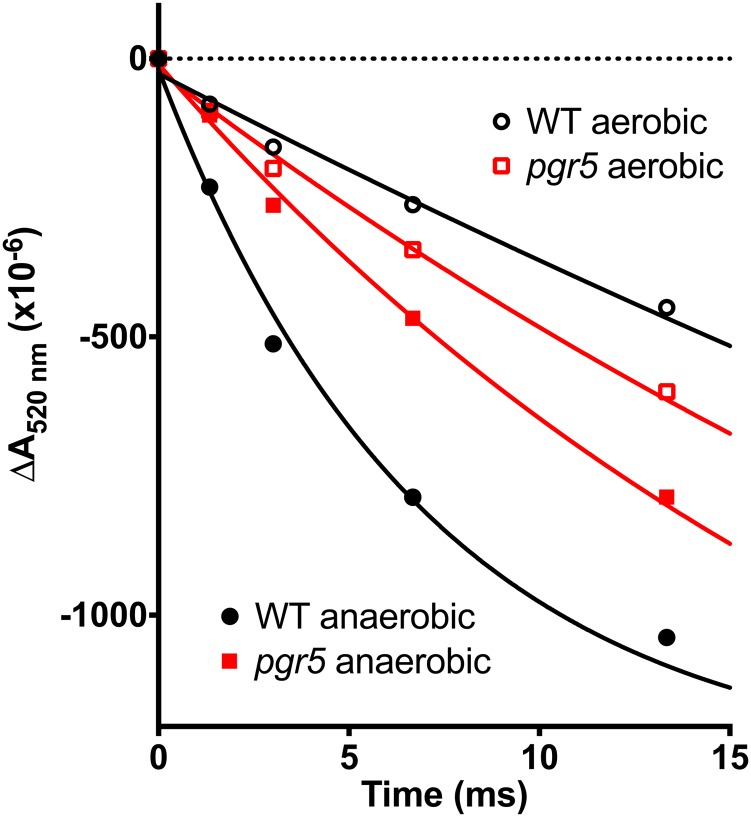
Figure 3.
Measurement of CEF rates after the ECS of carotenoids at 520 nm. Cells were grown in TAP and low light and treated with 10 μm DCMU and 1 mm hydroxylamine to inhibit PSII. Samples were adapted to aerobic (black and red symbols) or anaerobic (white symbols) conditions and preilluminated for 5 s with a saturating orange light delivering 1,000 μmol photons m−2 s−1. Flow rates were calculated after the cessation of illumination for more than three biological replicates and reported in Table I. One electron per PSI was calibrated with the ECS induced by a single turnover saturating flash. WT, Wild type. [See online article for color version of this figure.]

