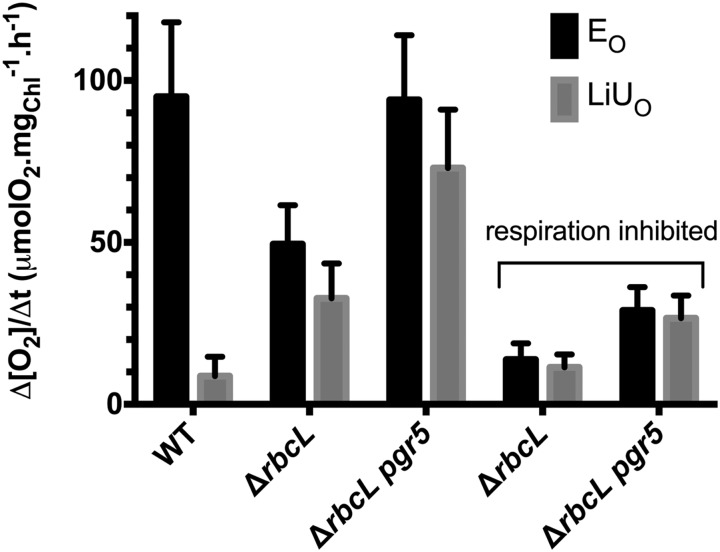
Figure 7.
Gas exchange measurements using labeled O2 to discriminate respiratory and photosynthetic fluxes in the wild-type (WT) line and ΔrbcL and ΔrbcL pgr5. The y axis shows the rate of EO or LiUO corrected for UO normalized to the chlorophyll content of the cells. The x axis shows the different strains tested. Respiratory inhibitors (20 μm myxothiazol and 200 μm SHAM) were added to measure the proportion of O2 exchange attributable to light-induced mitochondrial respiration in the ΔrbcL and ΔrbcL pgr5 strains. The data shown are the mean of n ≥ 3 replicates, and ses are shown for these replicates.

