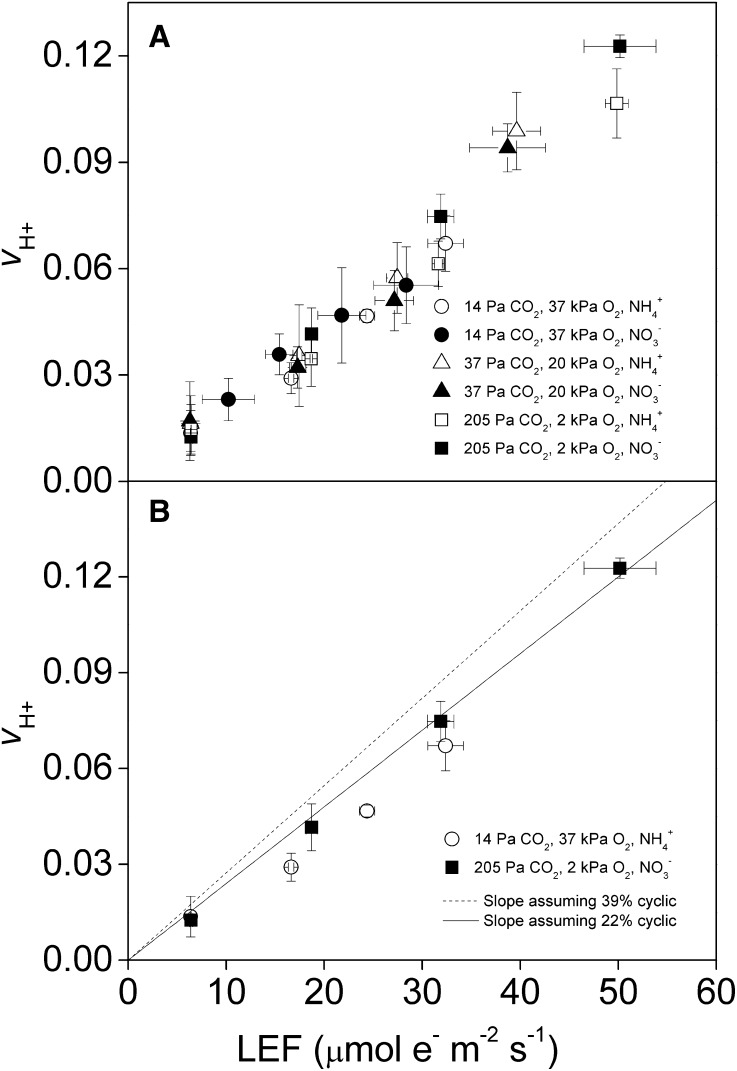
Figure 1.
Response of CEF to changes in ATP/NADPH demand under subsaturating PPFD. CEF was measured from the relationship of LEF (μmol e− m−2 s−1) to the rate of vH+ in relative units. The subsaturating light intensities ranged from 34 to 377 μmol m−2 s−1 PPFD. vH+ was determined spectroscopically from the dark relaxation of the ECS and LEF was determined using chlorophyll fluorescence. CEF was measured under various partial pressures of CO2 and oxygen (14 Pa of CO2 and 37 kPa of oxygen [circles], 37 Pa of CO2 and 20 kPa of oxygen [triangles], and 205 Pa of CO2 and 2 kPa of oxygen [squares]) and hydroponically supplied nitrogen (NH4+ [white symbols] or NO3− [black symbols]). All treatments (A) and treatments of the largest ATP/NADPH demand differences (B) are shown with modeled lines representing expected slopes assuming 24% CEF (solid line) and 39% CEF (dashed line), as presented in Table II. Values shown are averages of measurements from five separate plants ± se.

