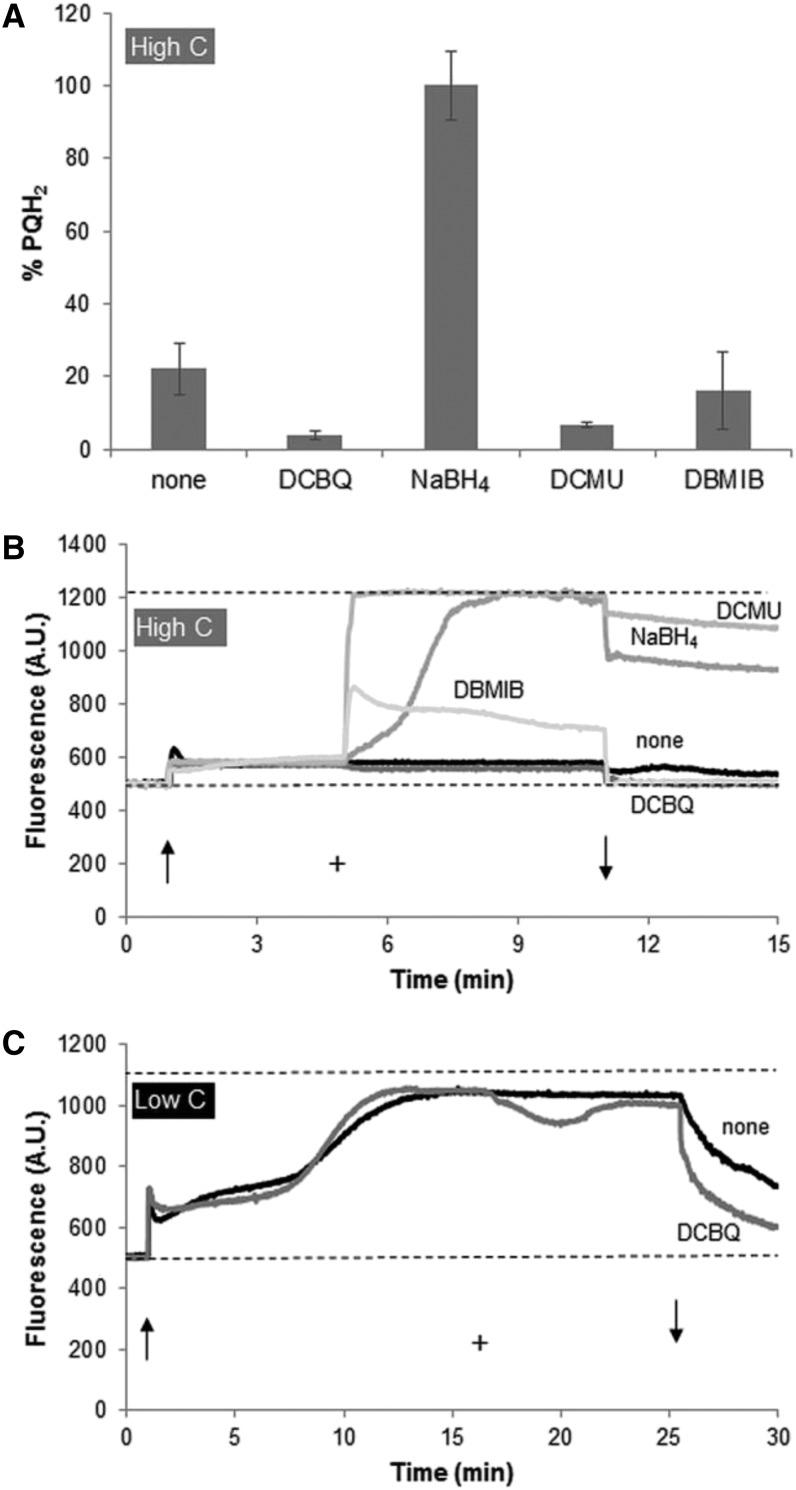
Figure 3.
PQ redox state (A) and chlorophyll a fluorescence recordings (B and C) demonstrating the response of Synechocystis sp. strain PCC 6803 cells to the addition of a range of different redox-active substances. PQ samples were taken 5 min after the addition of each chemical. Arrows indicate light on (↑) and light off (↓), and + indicates the addition of the chemical. A and B, Experiments conducted in BG-11 with 50 mm NaHCO3 and 60 µmol photons m−2 s−1 655-nm light (high-carbon conditions). C, Experiments conducted in BG-11 with 0.5 mm NaHCO3 and 100 µmol photons m−2 s−1 655-nm light (low-carbon conditions). Final concentrations were 10 µm DCBQ + 1 mm K3Fe(CN6), 2 mg mL−1 NaBH4, 20 µm DCMU, and 0.5 µm DBMIB. PQ redox state data in A are averages of three independent experiments, and error bars indicate sd. Chlorophyll a fluorescence data in B and C are from typical experiments. AU, Arbitrary units.

