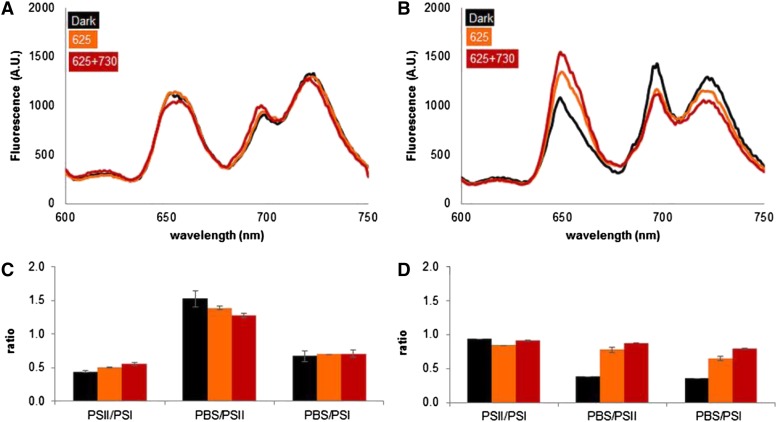
Figure 5.
77 K fluorescence emission spectra, recorded with 590-nm excitation, of Synechocystis sp. strain PCC 6803 cells sampled under different conditions of carbon availability and illumination (A and B) and ratios of peak areas derived through skewed Gaussian deconvolution of these spectra (C and D). A and C, BG-11 with 0.5 mm NaHCO3. B and D, BG-11 with 50 mm NaHCO3. Black bars, samples taken after 30 min in the dark; orange bars, samples taken after 10 min in 100 µmol photons m−2 s−1 625-nm light; red bars, samples taken 10 min after the addition of 25 µmol photons m−2 s−1 730-nm light to a background of 100 µmol photons m−2 s−1 625-nm light. The data shown are averages of biological duplicates; error bars in C and D indicate sd. The peaks at 655, 685, and 720 nm are due to emission from phycocyanin, PSII, and PSI, respectively. AU, Arbitrary units. [See online article for color version of this figure.]

