
FIG. 3.
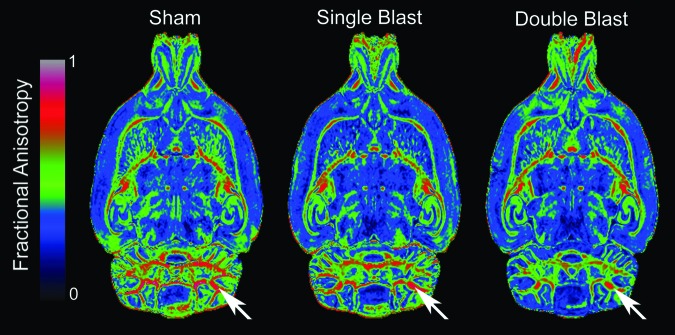
Representative fractional anisotropy (FA) maps from all three experimental groups. Horizontal FA images through the dorsoventral center of the cerebellar white matter are displayed with a heat-map lookup table (see legend) to highlight differences. FA differences between groups are apparent in the cerebellar white matter (arrows). Color image is available online at www.liebertpub.com/neu