. 2014 May 8;3:e02078. doi: 10.7554/eLife.02078

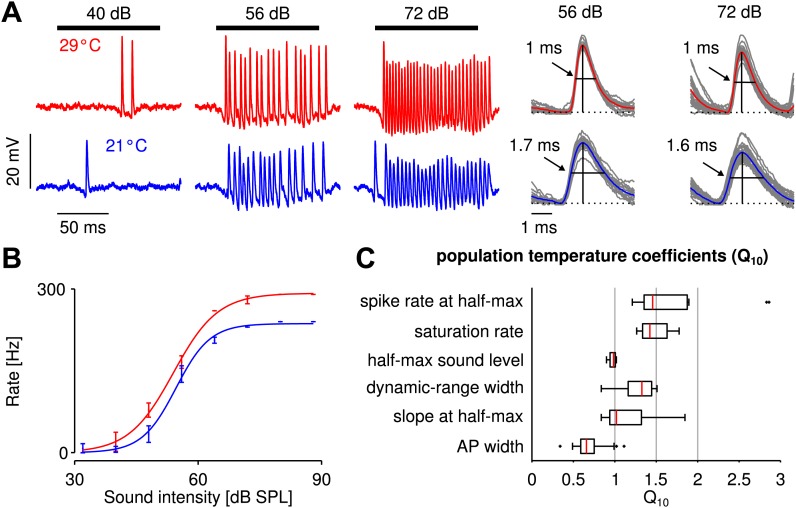
Figure 1. Cooling mildly affected electrophysiologically recorded firing rates generated by auditory receptor neurons in response to sound.

(A) Voltage traces at 29 and 21°C for one neuron (red and blue lines, respectively). Black horizontal lines mark time intervals of stimulus presentation; stimulus intensity as indicated. (B) Firing-rate as a function of sound intensity was well described by sigmoidal functions at both temperatures (same neuron as in A). The three sigmoidal parameters (saturation rate, sound level at half-maximum, and dynamic-range width) were extracted from fits to the experimental data. (C) Statistics of the measured temperature dependence, Q10(x)=(x(T+ΔT)x(T))10/ΔT, were computed for several quantities x. For a population of nine receptor neurons all three parameters of the sigmoidal function, as well as the spike rate and slope at the cold half-maximum were temperature compensated (median Q10[1,1.5], see also Figure 1—figure supplement 2 and Figure 1—figure supplement 3).

DOI: http://dx.doi.org/10.7554/eLife.02078.003

Figure 1.

Figure 1—figure supplement 1. Temperature calibration curve.
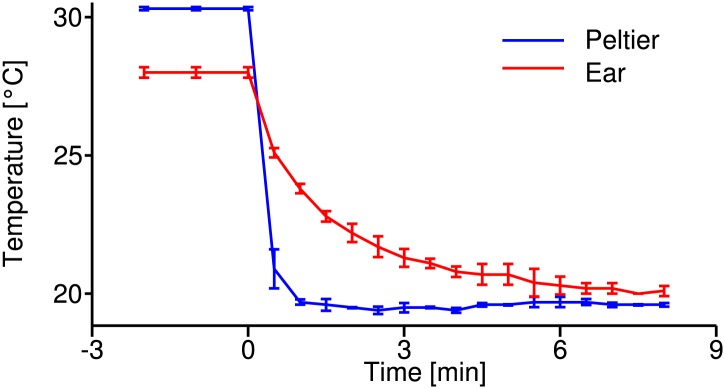
Figure 1—figure supplement 1.

Time course of temperature changes during the cooling-down procedure at the Peltier element (blue) and the tissue close to the tympanal membrane, where auditory receptor neurons attach (red); recordings from four animals. These curves were used as reference to estimate the temperature change during electrophysiological recordings.
Figure 1—figure supplement 2. Sound-intensity resolved p-values of statistical differences between firing rates at the two temperatures.
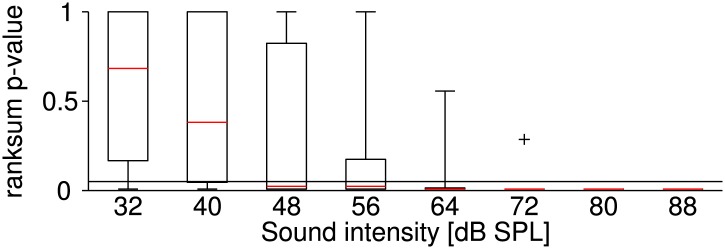
Figure 1—figure supplement 2.

Stimuli at each sound intensity were presented five times (before and after the temperature change). It was tested whether the corresponding firing rates at the two temperatures belong to an identical distribution with equal medians (ranksum test; p-values < 0.05 indicate a significant effect of temperature on firing rate). The figure illustrates the distribution of the test's p-values across all neurons at different levels of sound intensity (the symbol + indicates an outlier). The effect of temperature on firing rate was most significant for high sound intensities. Presumably, a higher relative variability in firing rate obscured the effect of temperature at lower firing rates (i.e., at lower sound intensities).
Figure 1—figure supplement 3. Statistical analysis of Q10 values.

Figure 1—figure supplement 3.

Statistical significance of observables shown in Figure 1C. Based on a Wilcoxon signed rank test the null hypotheses that the median of a distribution was 1, 1.5, or 2 were tested. For values of p<0.05 Q10 medians were statistically different (from 1, 1.5, or 2.0, respectively). Spike rates both at half-max and at saturation were significantly affected by temperature changes (Q10>1,p=0.001), but not significantly different from 1.5 (p0.4), indicating temperature compensation. Q10 values of saturation spike rates, in particular, were also significantly lower than 2.0. The median temperature dependencies of half-max sound level and slope at half-max were not significantly different from 1, indicating temperature invariance. Dynamic-range width and action-potential width significantly increased with cooling (medianQ10<1,p<0.01).