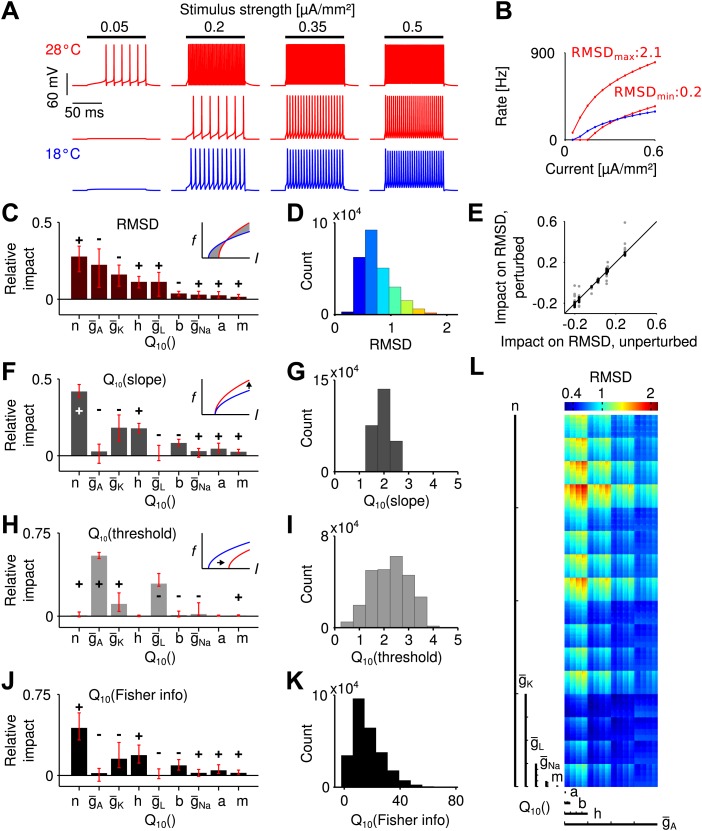
Figure 2. Temperature dependence of spike generation in a conductance-based neuron model.
(A) Voltage responses to step current stimuli of different amplitudes; blue: 18°C (the reference temperature), red: 28°C. Top trace corresponds to a model with strongly temperature-dependent firing rate, middle trace to a temperature-compensated model. (B) f-I curves at both temperatures, corresponding to the examples shown in A. (C) Results of the sensitivity analysis for the RMSD. The largest impact is exerted by temperature dependencies of the potassium conductances (, , and ). Signs +/− indicate the qualitative impact (see main text for details). (D) Distribution of the RMSD, across all models. Note that a of 1.5 corresponds to an RMSD of ∼0.5 (50% relative change). (E) Parameter impacts on RMSD were robust against ±20% perturbation of the model's peak conductances at 18°C (black symbols: perturbations of individual peak conductances; grey symbols: all combinations of ±20% changes to the four peak conductances). (F) Results of the sensitivity analysis for the temperature dependence of the slope of f-I curves. (G) Distribution of values of the slope across all models. (H and I) as panels (F) and (G), but for the threshold of the f-I curves. (J and K) Sensitivity analysis of information transfer. For two basic noise models (Poissonian and input-independent Gaussian), the temperature dependence of firing rate-based information transfer J is related to that of the slope of the f-I curve: . The conductance parameters with highest impact were very similar to those of the changes in slope (compare to panel F). Information transfer increased with temperature for all models. (L) Visualization of the RMSD for the parameter space spanned by the temperature dependencies of the Connor-Stevens model based on dimensional stacking. Axes order was chosen according to the impact ranking as presented in (C); color code as in (D).


