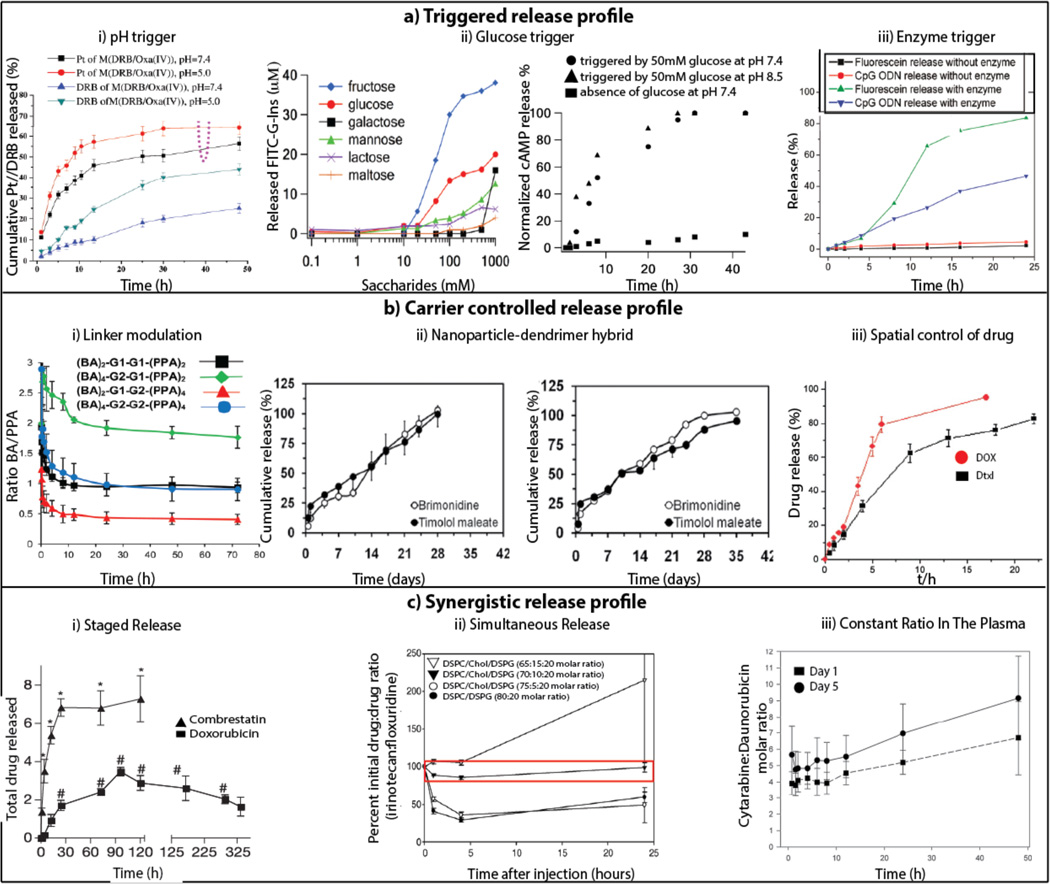
Figure 2.
Diverse release profiles of co-delivery. ai) Increased release of platinum (Pt) and daunorubicin (DRB) at pH 5.0 compared to release at pH 7.4. Reprinted20 with permission from Elsevier. aii) Release of FITC-G-Ins triggered by glucose (Left). Release of cAMP triggered by glucose (Right). Reprinted21 with permission from The American Society. aiii) Increased release of CpG ODN and fluorescein in the presence of an enzyme, α-chymotrypsin. Reprinted22 with permission from American Chemical Society. bi) Modulating the release profile of BA and PPA based on the generation numbers. Reprinted23 with permission from American Chemical Society. bii) Release from PLGA nanoparticles (Left) compared to sustained release of brimonidine and timolol maleate from PLGA nanoparticles-dendrimer hybrid (Right). Reprinted24 with permission from American Chemical Society. biii) Spatially controlled release of DOX and Dtxl. Reprinted25 with permission from John Wiley and Sons. ci) Staged release demonstrated by fast release of combrestatin and slow release of DOX. Reprinted26 with permission from Nature Publishing Group. cii) Release of irinotecan and floxuridine at a constant synergistic 1:1 ratio for 25 hrs. Reprinted27 with permission from Elsevier. ciii) Release of cytarabine and daunorubicin at a constant synergistic ratio of 5:1 in the plasma. Reprinted28 with permission from Elsevier.

