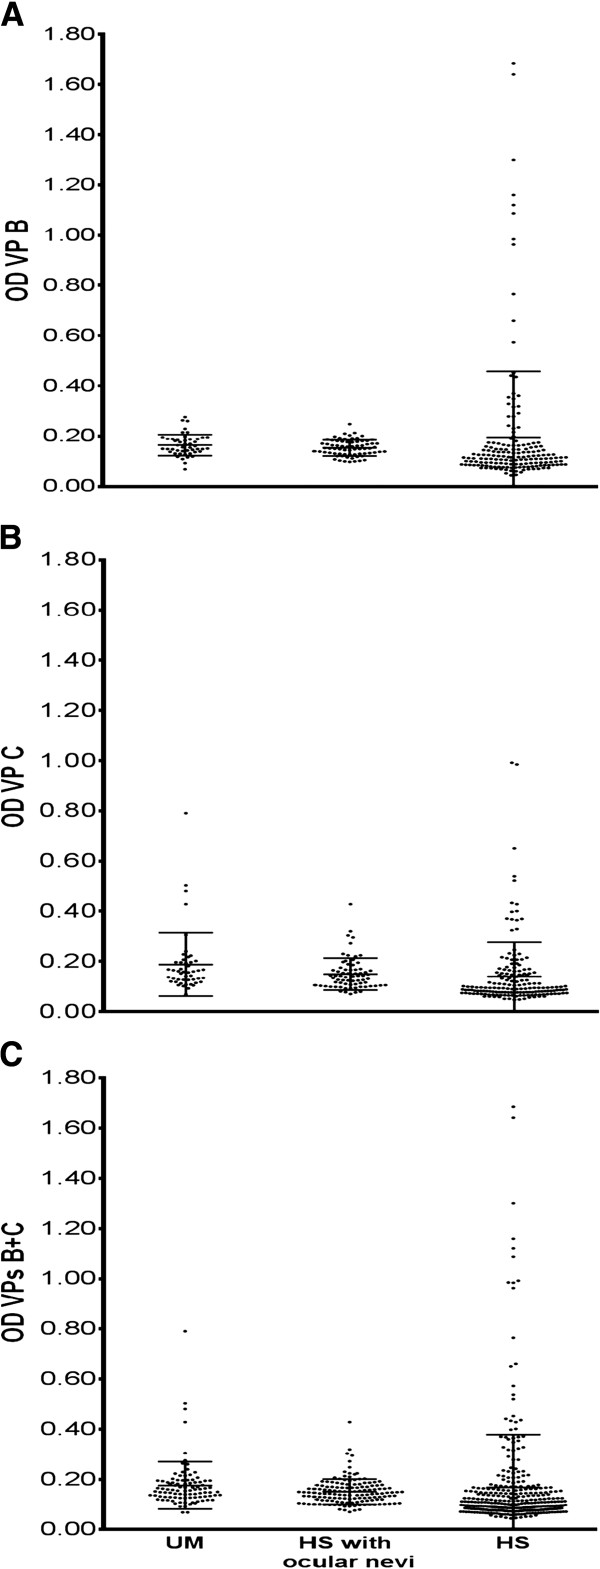
Figure 1.
Serologic profile. Serologic profile of serum antibody reactivity to SV-40 mimotopes VP1 B (panel A) and VP2/3 C (panel B) and VPs B + C (panel C). Immunologic data are from patients affected by UM and from healthy individuals (HS) with and without ocular nevi. Data are OD values at 405 nm of serum samples diluted 1:20, detected in indirect ELISA. In scatter dot plotting, each plot represents the dispersion of OD values to a mean level indicated by the line inside the scatter with standard error mean (SEM) for each group of subjects analyzed (Mean OD ± SEM).

