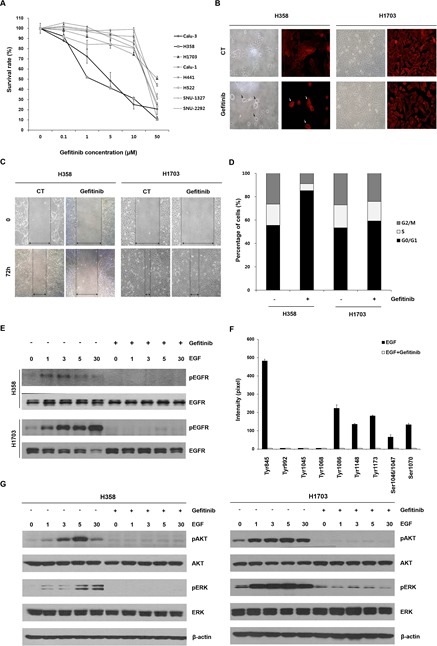
Figure 1. Effects of gefitinib in lung cancer cells with wtEGFR.

(A) Changes in cell survival caused by gefitinib were determined using MTT assay. The cells were treated with the indicated concentrations of gefitinib for 72 h. Each data point represents mean results of six independent determinations with the standard error (SE). (B) Morphological changes caused by gefitinib were representatively analyzed in H358 and H1703 cells using light microscopy and red fluorescent-conjugated phalloidin staining. After a 48 h incubation with or without gefitinib (10 μM), cell images were captured at a magnification of 200×. Black and white arrows indicate the morphologically changed cells (C) Changed cell motility capacity was evaluated using a wound healing assay. The cell images after treatment with gefitinib (10 μM) were captured at a magnification of 100×. (D) Redistributed percentages of the cell cycle caused by gefitinib were evaluated after PI staining and flow cytometry. Data represent mean results acquired from three independent experiments. (E) Effects of gefitinib on epidermal growth factor (EGF)-induced epidermal growth factor receptor (EGFR) phosphorylation were examined using Western blot analysis. The cells were pretreated with gefitinib (10 μM) under serum-free conditions for 24 h and incubated for further indicated times in the presence or absence of 100 ng/ml EGF. (F) Statuses of multiple phosphorylation sites of EGFR in H1703 cells were determined using an antibody array. Relative expression levels of phosphorylated EGFR sites were calculated with a gel doc image analyzer. The ratio of phosphorylated EGFR was normalized to total EGFR acquired from three experiments in the same membrane. Each bar is the SE. (G) The effects of gefitinib on EGF-induced phosphorylation of ERK and AKT were evaluated by Western blot analysis.
