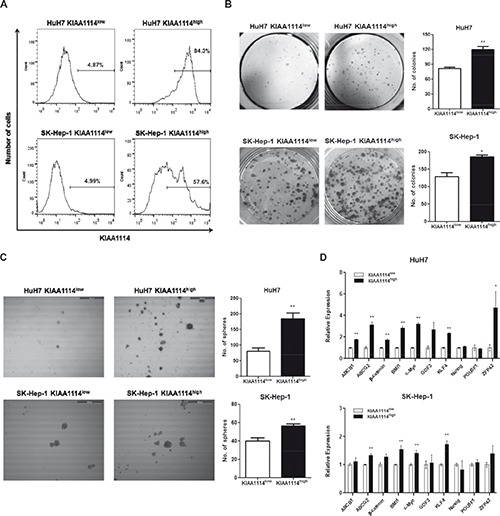
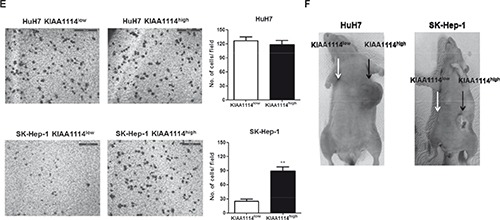
Figure 4. TIC-like properties of KIAA1114high HCC cells.


(A) Flow cytometric analysis of sorted KIAA1114high and KIAA1114low cells from HuH7 and SK-Hep-1 cell lines. (B) Colony formation assay of KIAA1114high and KIAA1114low fractions isolated from HuH7 and SK-Hep-1 cells. 2,000 sorted cells were seeded into 6-well plates in triplicate and cultured for 2 weeks. The resulting colonies were stained with crystal violet and counted under the microscope. Representative images are shown. *p <0.05; **p<0.01. (C) Sphere forming assay of purified cells. 2,000 KIAA1114high and KIAA1114low cells were plated in 6-well ultra-low attachment dishes and cultured for 2 weeks. Spheres were counted and photographed using the microscope. Scale bars: 500 μm. **p <0.01. (D) Quantitative real-time PCR analysis of stemness-related genes in KIAA1114high and KIAA1114low cells derived from HuH7 and SK-Hep-1.*p <0.05; **p<0.01. (E) Transwell migration assay of KIAA1114high and KIAA1114low subsets. 5 × 10⁴ HuH7-sorted or 1 × 10⁴ SK-Hep-1-sorted cells were seeded onto the upper chamber and incubated for 16 hours. Migrated cells were stained with Diff-Quik and counted. Representative microscopic fields are shown. Scale bars: 500 μm. **p <0.01. (F) Representative images of beige/nude/xid mice subcutaneously injected with 1 × 10⁴ HuH7-sorted or 1 × 10⁵ SK-Hep-1-sorted KIAA1114high cells (black arrow) and KIAA1114low cells (white arrow). The photographs were taken 3 months after injections. All graphically represented data are shown as average ± SEM.
