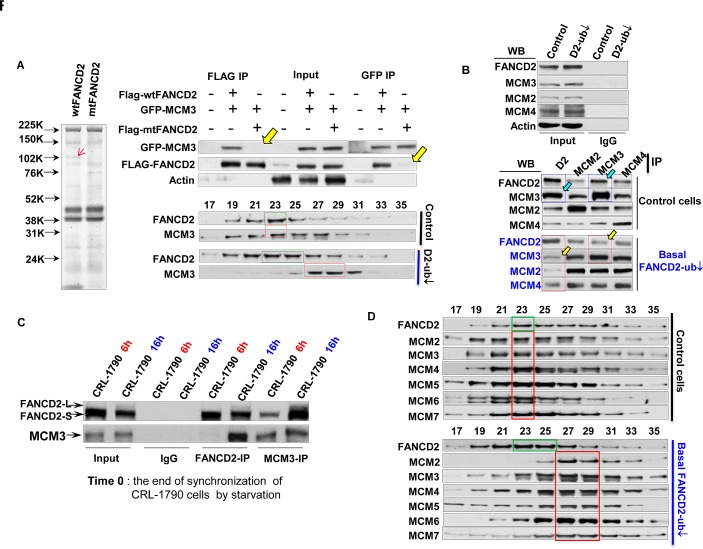
Figure 3. Normally Monoubiquitinated FANCD2 Interacts with MCM3 in an S-phase specific manner and Maintains the Optimal Function of MCM2-7-Containing Protein Complex.
A. FANCD2 interacts with MCM3. Left panel: Simple blue-staining (taken in gray color) of an 8-16% gradient gel shows “an extra band” in one lane and not in the other control lane. The gel was resolved with Flag-IP elutes, which were prepared from Flag-wtFANCD2 or mtFANCD2 transfected CRL-1790 cells. “The extra band” pointed by a red arrowhead was sliced for mass spectrometry (The equal transfection efficiency of CRL-1790 cells with Flag-wt or mt FANCD2 is shown in Supplementary Fig. 3A). Right panel: CRL-1790 cells were used for transient co-transfection of GFP-fused MCM3 and Flag-wtFANCD2 or Flag-mtFANCD2 K561R. Cell lysate were prepared 48 hr post-transfection. Both Flag and GFP antibodies were used to perform reverse immunoprecipitation (IP) and Western blotting (WB). As yellow arrowheads indicated, Flag-mtFANCD2, unlike Flag-wtFANCD2, is not clearly associated with GFP-MCM3 (top part) (The transfection efficiency was comparable among transfected cells, please see IP input). The sepharose 6B chromatography (gel filtration) was performed using normally growing CRL-1790 set of stable cells (Supplementary Fig. 2B1 left panel). The endogenous FANCD2 co-peaks with endogenous MCM3 in cells carrying a normal basal level of FANCD2 monoubiquitination (middle part), but not in the cells carrying a compromised basal level of FNACD2 monoubiquitination (bottom part) (Fractions #9 and #30 correspond to the size markers of 2000 kDa and 669 kDa respectively, and the whole panel of markers is shown in Supplementary Fig. 3C). B. Confirmation of the interaction between endogenous MCM3 and FANCD2. Pool fractions from #21 to #25 were used to perform reverse IP-WB between FANCD2 and MCM3, MCM2 or MCM7, which also are a representative for MCM5, MCM6 or MCM4, respectively, given three sub-complexes (MCM3&5, MCM2&4, and MCM7&4) formed among MCM family members. FANCD2 appears to interact primarily with MCM3, but not with MCM2 or MCM7, whose antibodies pulled down a low amount of FANCD2 protein as compared to MCM3 antibodies. Vice versa, FANCD2 antibodies pulled down more MCM3 proteins as compared to the amount of MCM2 or MCM7 proteins pulled down. C. The Interaction between MCM3 and FANCD2 proteins is S-phase Specific. The reverse IP-WB of MCM3 and FANCD2 was performed using the same batch of synchronized cells used (Fig. 2A). The FANCD2 antibodies can pull down more MCM3 proteins from the lysates of the cell pool enriched in S but not in G1 phase of normal cell cycle. Similarly, MCM3 antibodies can pull down more FANCD2 proteins from the lysates of the cell pool enriched in S-phase, but not in G1 phase. D. The Size of MCM2-7 protein complex is compromised in cells carrying a low basal level of FANCD2 monoubiquitination, as compared to the one present in cells with a normal level of FANCD2 monoubiquitination. Gel-filtration was done by using nuclear extracts prepared from normally growing CRL-1790 set of stable cells carrying a normal or reduced basal level of FANCD2 monoubiquitination. The endogenous FANCD2 (marked with a green frame) and all 6 members of MCM complex (a red frame) co-peak at fraction #23 (top panel), but they do not co-peak at the same fraction, but 6 members of MCM family remain co-peak together at a different fraction (#27) (bottom panel) (Fractions #9 and #30 correspond to the size markers of 2000 kDa and 669 kDa respectively).

