
Figure 5.
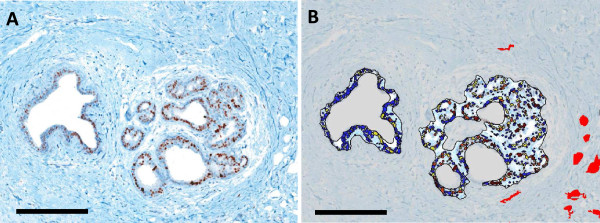
ER positivity in DCIS relative to vascular localization: A) DCIS lesions stained this ER were B) isolated from the adjacent stroma and the individual cells were segmented and classified as negative (blue), weak (yellow), moderate (orange) and strong (red) stain intensity expression. Simultaneously CD34 serial sections were used to identify, isolate and mask (red) vessels. Together this image demonstrates an overlain image set of ER classification and vessel localization. Cells nearer the vasculature were observed to have stronger ER expression than cells distant from the vessels. Scale bars = 250 μm.