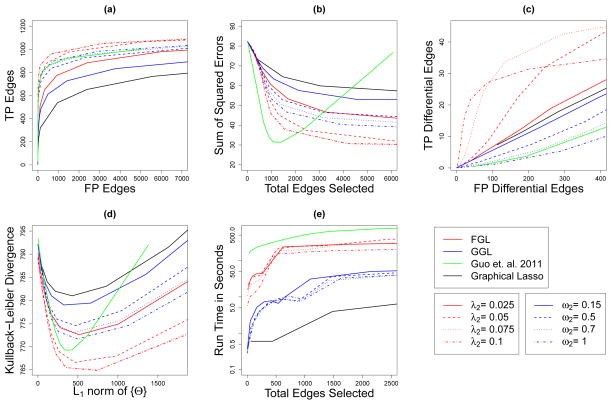
Fig. 2.
Performance of FGL, GGL, Guo et al. (2011)’s method, and the graphical lasso on simulated data with 150 observations in each of 3 classes, and 500 features. Black lines display models derived using the graphical lasso, green lines display the proposal of Guo et al. (2011), red lines display FGL, and blue lines display GGL. (a): The number of edges correctly identified to be nonzero (TP Edges) is plotted against the number of edges incorrectly identified to be nonzero (FP edges). (b): The sum of squared errors in edge values is plotted against the total number of edges estimated to be nonzero. (c): The number of edges correctly found to have values differing between classes (TP Differential Edges) is plotted against the number of edges incorrectly found to have values differing between classes (FP Differential Edges). (d): The dKL of the estimated models from the true models is plotted against the ℓ1 norm of the off-diagonal entries of the estimated precision matrices. (e): Running time (in seconds) is plotted against the number of non-zero edges estimated. Note the use of a log scale on the vertical axis.

