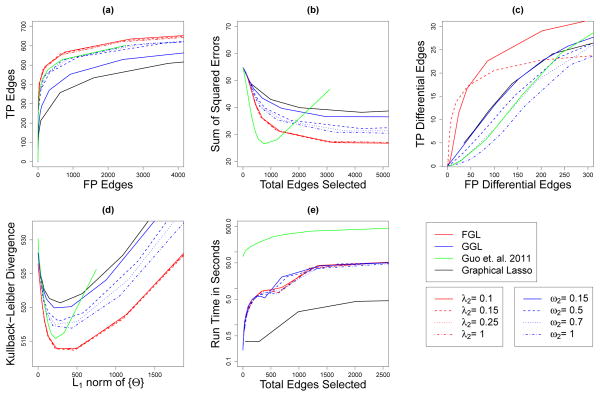
Fig. 4.
Performance of FGL, GGL, Guo et al. (2011)’s method, and the graphical lasso on simulated data with 150 observations in each of 2 classes, and 500 features corresponding to ten equally sized, unconnected subnetworks drawn from a power law distribution. Details are as given in Figure 2.

