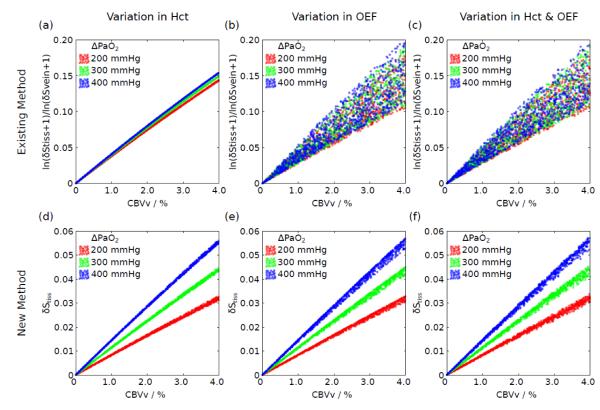
Figure 1.
Simulation of the relationship between the measured signal and true CBVv for the existing (Eq. [10]) and new methods (Eq. [11]). Three different hyperoxia levels were simulated described by the change in arterial PO2 (ΔPaO2). The effect of variations in haematocrit (a,d) and OEF (b,e) alone, and in combination (c,f), are considered. A large amount of uncertainty is observed for the existing method suggesting that it cannot accurately account for physiological variability. By plotting the unnormalised tissue BOLD signal response a much tighter and approximately linear response is revealed.

