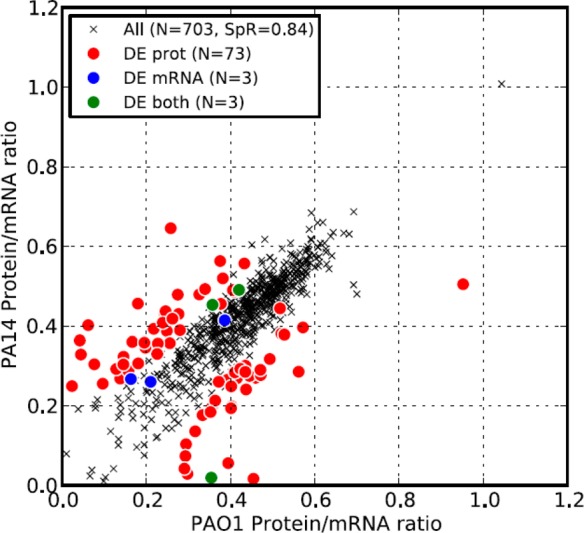
Figure 2.

Protein-to-mRNA ratios are well-conserved between P. aeruginosa strains. Correlation of protein-to-mRNA ratios between PAO1 and PA14. Protein-to-mRNA ratios were calculated as the ratio of the log2-transformed APEX score to the log2-transformed microarray signal (ratio is not log transformed). Although the two strains showed strong correlation in their protein-to-mRNA ratios (Spearman rank correlation 0.84, p value < 10–9), most genes with statistically different expression at the protein level also showed a statistically significant difference between the protein-to-mRNA ratios from the two strains (red circles). Only genes for which we detected proteins in both PAO1 and PA14 are presented. DE mRNA: differentially expressed genes at the mRNA level but not at the protein level between two strains. DE protein: differentially expressed genes at the protein level but not at the mRNA level. DE both: differentially expressed genes at both the mRNA and protein level. SpR: Spearman rank correlation.
