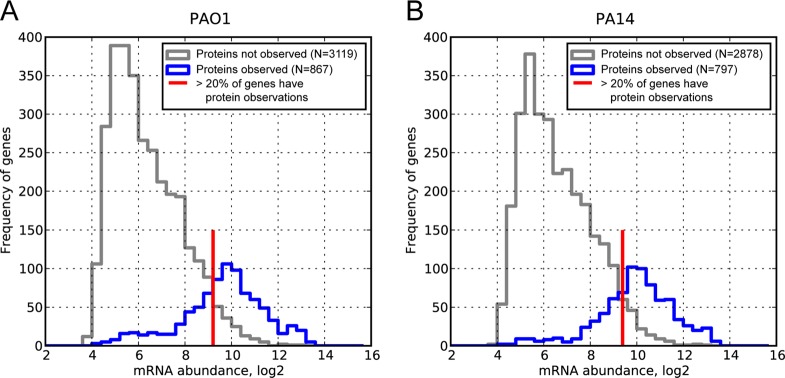
Figure 4.

Candidates for translation repression can be selected from histograms of mRNA concentrations with and without corresponding protein observations: (A) PAO1 and (B) PA14. The gray line represents the frequencies of genes with a microarray signal (log2-transformed) for which proteins were not observed in shotgun proteomics. The blue line represents the frequencies of genes with a microarray signal for which we also measured the corresponding protein. Some genes with high microarray signals are still not observed at the protein level (gray line to the right of the red mark) and may be translationally repressed or targeted for degradation. To identify candidates for such regulation, we considered mRNAs for which protein was not observed with abundances above the red line (corresponding to an 80% chance of detecting protein). To increase the stringency further, we sorted all genes with microarray signals greater than the cutoff and discarded the bottom 20% of the list. In total, 181 genes were identified as putatively translationally repressed, and 97 showed in both PAO1 and PA14 (Supporting Information Table S4). Because it is possible that low detectability in shotgun proteomics can produce this bias, we corrected for mass spectrometry detectability using the APEX method.
