Figure 6.

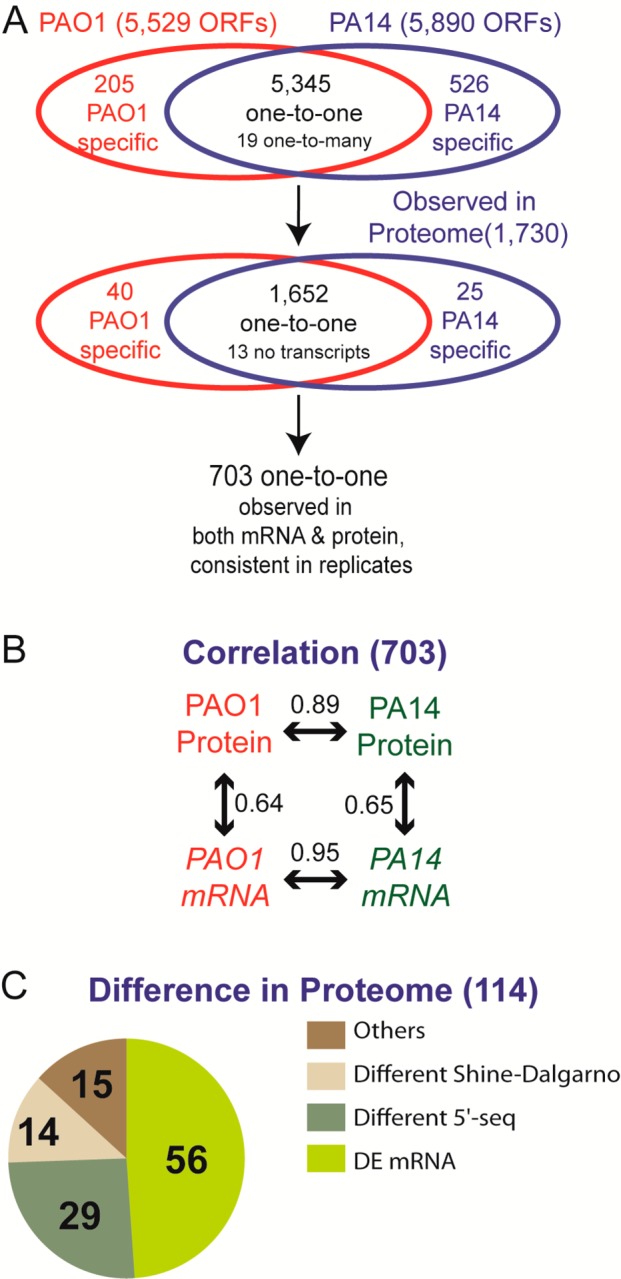
Overview of the proteomic measurements in this study. (A) Out of 5345 genes with one-to-one orthology between PAO1 and PA14, we measured proteome and transcriptome abundance of 703 genes with highly stringent criteria of reproducibility between biological replicates. (B) We observed that protein (Spearman rank correlation 0.89) and mRNA (Spearman rank correlation 0.95) abundances are highly conserved, much more than those abundances within each strain. (C) Out of 114 genes showing significantly different protein levels between PAO1 and PA14, about half of them (56 genes) showed different mRNA abundances and 43 genes showed different 5′ sequences (assuming that different 5′ sequence may affect translation repression efficiency). However, fewer than half of 5′ sequence differences were relevant to differences in the Shine–Dalgarno sequence. Fifteen differentially expressed proteins with identical 5′ sequences and similar mRNA abundances may be regulated by strand-specific post-transcriptional mechanisms (Table 3).
