
Figure 12. Temperature versus time of multiple runs (n = 10) measured at the exothermic reaction (red), interface with the phase change material (green), and at the nucleic acid amplification reaction (blue).
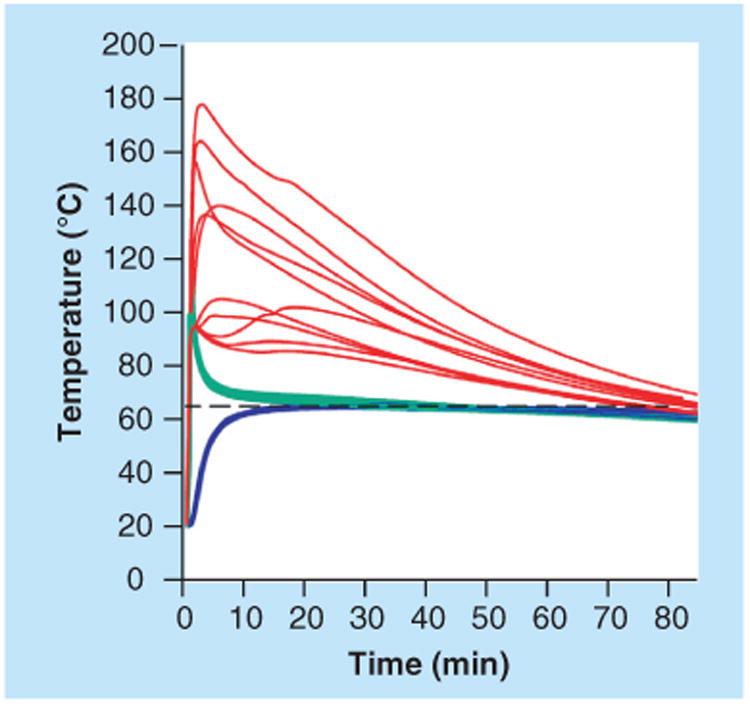
Reproduced from [75].
Please see colour figure at www.Futuremedicine.com/doi/suppl/10.4155/Bio.13.243